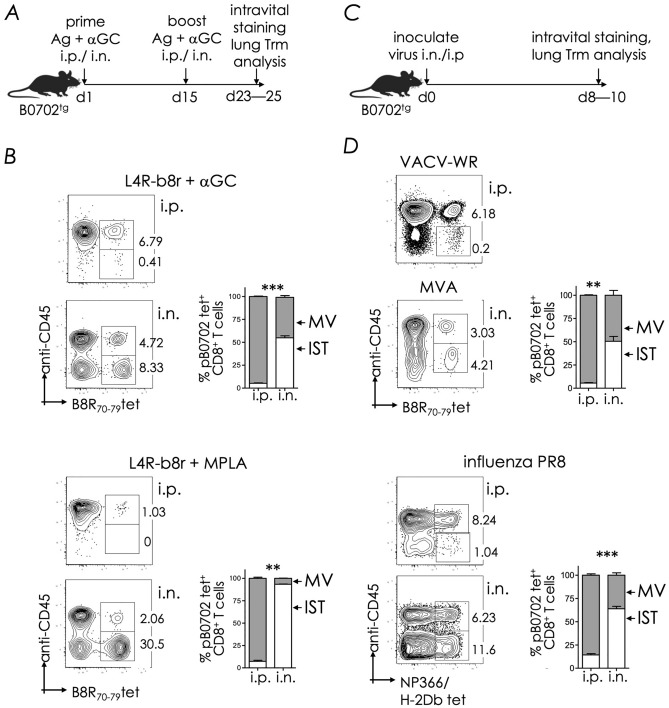
Figure 1.
Distribution of immune CD8+ T cells in distinct lung compartments. (A) Experimental design: Mice were prime boost immunized i.p. or i.n. with L4R-b8r and αGC. On the day of harvest, mice were injected i.v. with anti-CD45.2-APC and euthanized after 5 min to allow intravital staining of circulating leukocytes. (B) Lungs were harvested and relative abundance of CD8+ Tem (marginated vasculature, MV) and Trm (interstitial, IST) cells in lungs based on the frequency of staining with anti-CD45.2-APC and B8R70—78/B0702 tetramer-PE. Plots are gated on viable CD8+ T cells. Bar graphs show relative ratio of Tem and Trm. (C) Experimental design: Mice were inoculated i.p. or i.n. route with the virus indicated in panel (D). After 8—10d post-inoculation (p.i.), mice were injected i.v. with anti-CD45.2-APC, and euthanized after 5 min. D. Lungs were harvested and analysed as in panel (B). Cumulative data from 2—3 independent experiments (n = 3–12 mice/group), mean ± SEM.

