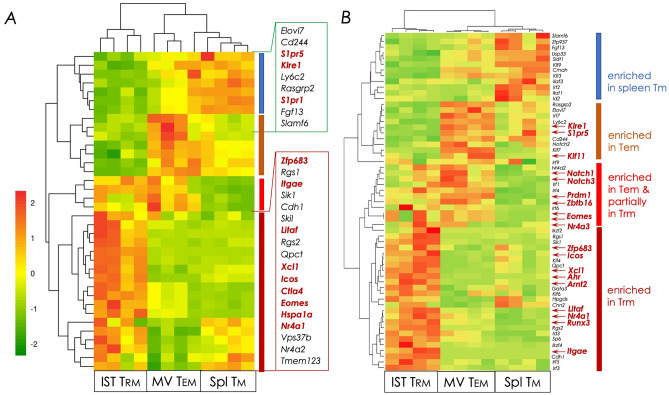
Figure 5.
Heat map representation of Trm signature genes. Clusters of differentially expressed transcripts within CD8+ IST Trm, MV Tem, and splenic Tm cell subset were ordered by K-means clustering analysis as described in Materials and Methods. Bulk RNAseq data derived from the three CD8+ memory T cell subsets were used for this analysis. (A) Differential expression of thirty-six previously reported Trm cell signature genes3 wherein log2 fold change ≥1.5 with adjusted p ≤ 0.05 are shown. Blue side bar, splenic Tm cell-; brown side bar, lung MV Tem cell-; red sidebar, common MV Tem & lung IST Trm-; and maroon sidebar, IST Trm-specific gene expression pattern. (B) Differential expression analysis of transcriptional factors along with Trm signature genes3, 49 were performed as in (A) using bulk RNAseq data derived from the three memory T cell subsets. Highlighted are differentially expressed transcripts with log2 fold change ≥1.2 with adjusted p ≤ 0.05 are shown. Sidebars are the same as in (A).

