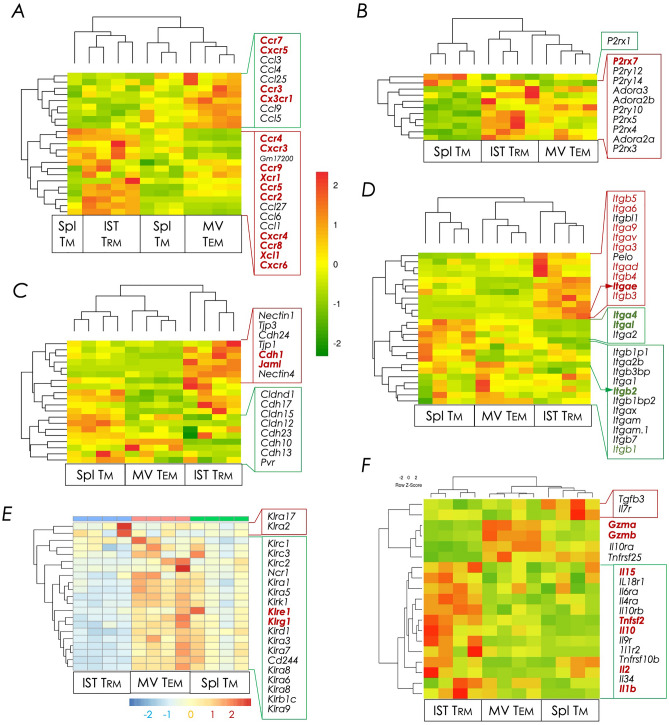
Figure 6.
Heat map representation of pathway-specific gene expression changes. Clusters of differentially expressed transcripts specific within the indicated pathways (A–F) were ordered by K-means clustering analysis as described in Materials and Methods. Bulk RNAseq data derived from CD8+ IST Trm, MV Tem, and splenic Tm cell subsets were used for this analysis. (A) Chemokines and chemokine receptors. (B) Integrins. (C) Cell adhesion molecules. (D) Purinergic receptors. (E) inhibitory & activating killer cell lectin-like receptors. (F) T cell effector molecules.

