Figure 2.
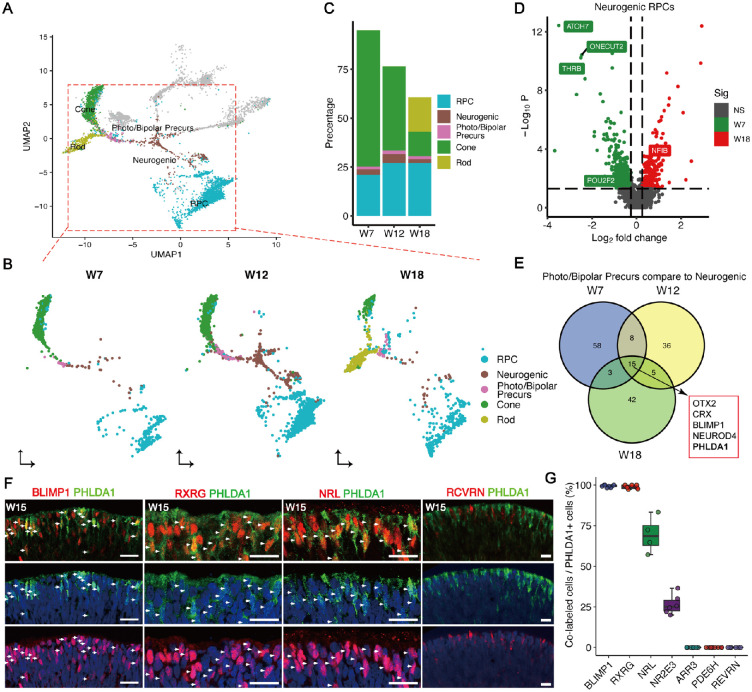
Temporal specification of photoreceptor subtypes in retinal organoids. (A) UMAP plot highlighting the cell types in photoreceptor cell development trajectory. (B) Cell type distribution of cell types in photoreceptor cell development trajectory at three points. (C) Stacked plots showing the proportions (%) of each photoreceptor lineage at the indicated development time points. (D) Volcano plot displaying fate determining factors differentially expressed between neurogenic RPCs at early stage (W7) and late stage (W18). (E) Venn plot showing the common upregulated genes in photoreceptor precursors across three stages. (F) Co-expression of PHLDA1 with BLIMP1, RCVRN, RXRG, or NRL shown by immunofluorescence. Scale bars = 20 µm. Arrowheads indicate co-localization of PHLDA1 with others markers of photoreceptors. (G) Histogram showing the proportions (%) of PHLDA1+ cells co-expressing either BLIMP1, RXRG, NRL, NR2E3, PDE6H, ARR3, or RCVRN.

