. 2022 Oct 12;13(43):12634–12642. doi: 10.1039/d2sc04058a

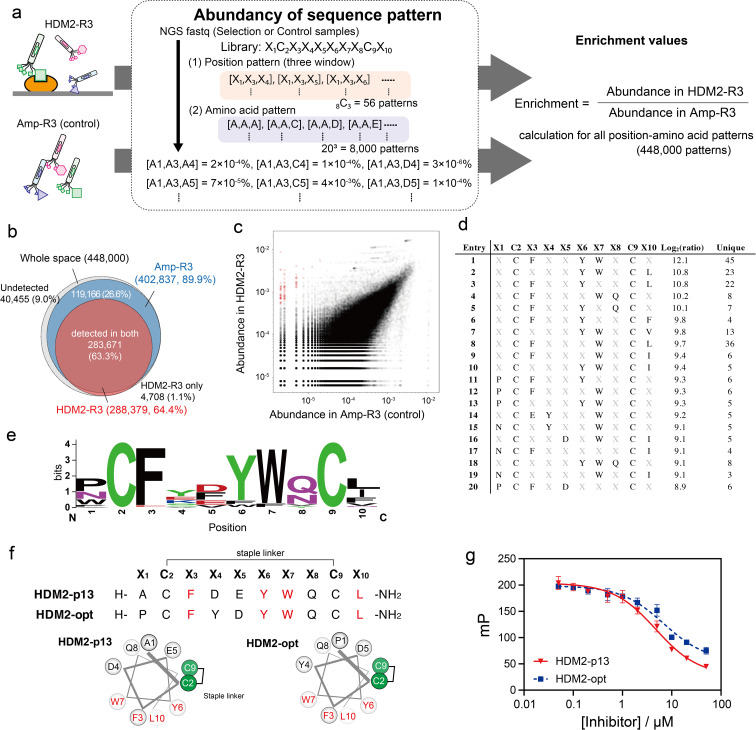
Fig. 4. Position–amino acid pattern enrichment analysis of the HDM2-R3 pool. (a) Pattern enrichment score calculation. For both sequence data (FASTQ), the abundance of each position–amino acid pattern was determined. Enrichment values were calculated as the ratio of abundance in the selected sample to that in the control sample. (b) Venn diagram showing pattern coverage (white, whole space of three-window patterns; blue, patterns found in Amp-R3 dataset; red, patterns found in HDM2-R3 dataset). (c) Scattering plot indicating the abundance of control (x-axis) and HDM2-R3 selected sample (y-axis). Red circles are patterns with log2(ratio) values greater than 8. (d) Position–amino acid patterns ranked in the top 20. (e) WebLogo depicting enriched sequences determined from enriched patterns with log2(ratio) values greater than 8. (f) Sequences and helical wheel diagrams of HDM2-p13 and HDM2-opt peptides. Highly enriched residues are coloured red. (g) Fluorescence polarisation assay for competitive inhibition. Peptides (50 nM to 50 μM) were mixed with 100 nM HDM2 and 10 nM FAM-ATSP-3848. IC50 was calculated as 4.8 ± 0.6 and 6.9 ± 1.9 μM for HDM2-p13 (red) and HDM2-opt (blue), respectively. Error bar represents SD (n = 3).

Fig. 4