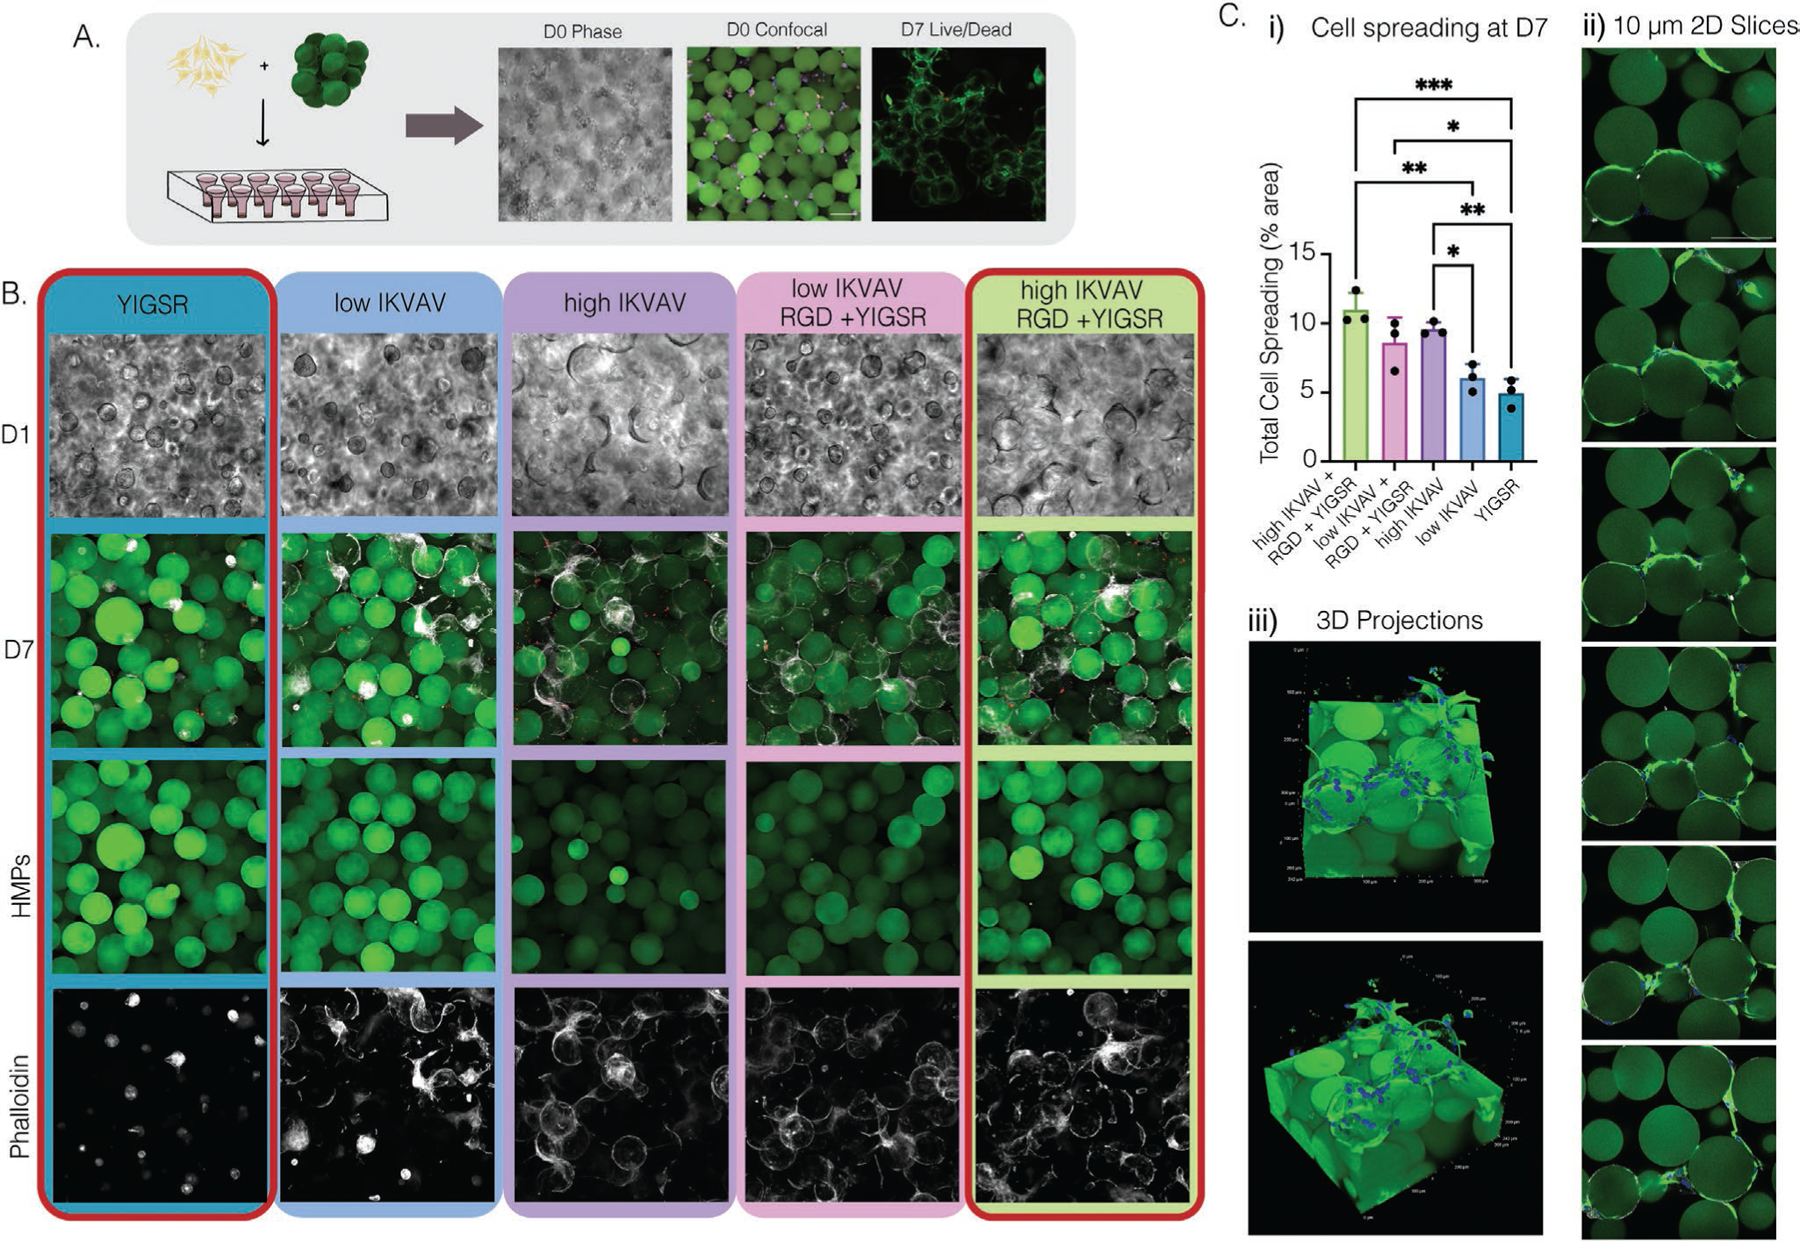
Figure 3.

A) Schematic and representative images of NPC seeding within MAP scaffold. D0 in both phase and confocal images show even cell distribution within the scaffold. Confocal image of live/dead stain cell viability at D7. B) 20× phase images of D1 and 20× confocal images at D7 were taken. Microgels were stained (green) and cells were stained for phalloidin (white). C) i) Cell spreading at D7 was qualified using confocal imaging and IMARIS. ii) Slices of z-stack images from the high IKVAV, RGD, + YIGSR condition with NPCs labeled with GFAP (green) and microgels (green). iii) 3D volume renderings of MAP scaffolds containing NPCs from the high IKVAV, RGD, + YIGSR condition, microgels (green), and cell nuclei labeled with DAPI (blue) and NPCs labeled with GFAP (green). Tukey’s multiple comparison test (P < 0.05) (n = 3 unless specified otherwise).
