. 2022 Nov 9;130(11):116001. doi: 10.1289/EHP11015

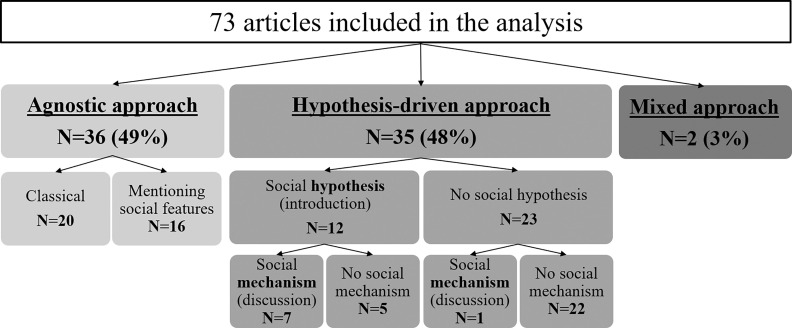
Figure 2.

Figure 2 is a flowchart with three steps. Step 1: 73 articles included in the analysis leads to 36 articles that is 49 percent of Agnostic approach, 35 articles that is 48 percent of Hypothesis-driven approach, and 2 articles that is 3 percent of mixed approach. Step 2: Agnostic approach group of articles is subdivided as: 20 articles using classical agnostic approach and 16 articles mentioning social features. Hypothesis-driven approach group of articles is subdivided as 12 articles mentioning social hypothesis (introduction) and 23 articles mentioning no social hypothesis. Step 3: The group of 12 articles mentioning social hypothesis in introduction is subdivided as: 7 articles discussing social mechanism (discussion) and 5 articles discussing no social mechanism. The group of twenty-three articles mentioning no social hypothesis is subdivided into 1 article discussing social mechanism (discussion) and 22 articles discussing no social mechanism.

Social environment, a priori hypotheses and underlying mechanisms. Detailed table is available in Table S4. Note: Agnostic approach, data exploration with no predefined hypothesis of interest; hypothesis-driven approach, test of an explicit hypothesis about the relationship between exposure(s) and outcome(s).