Figure.
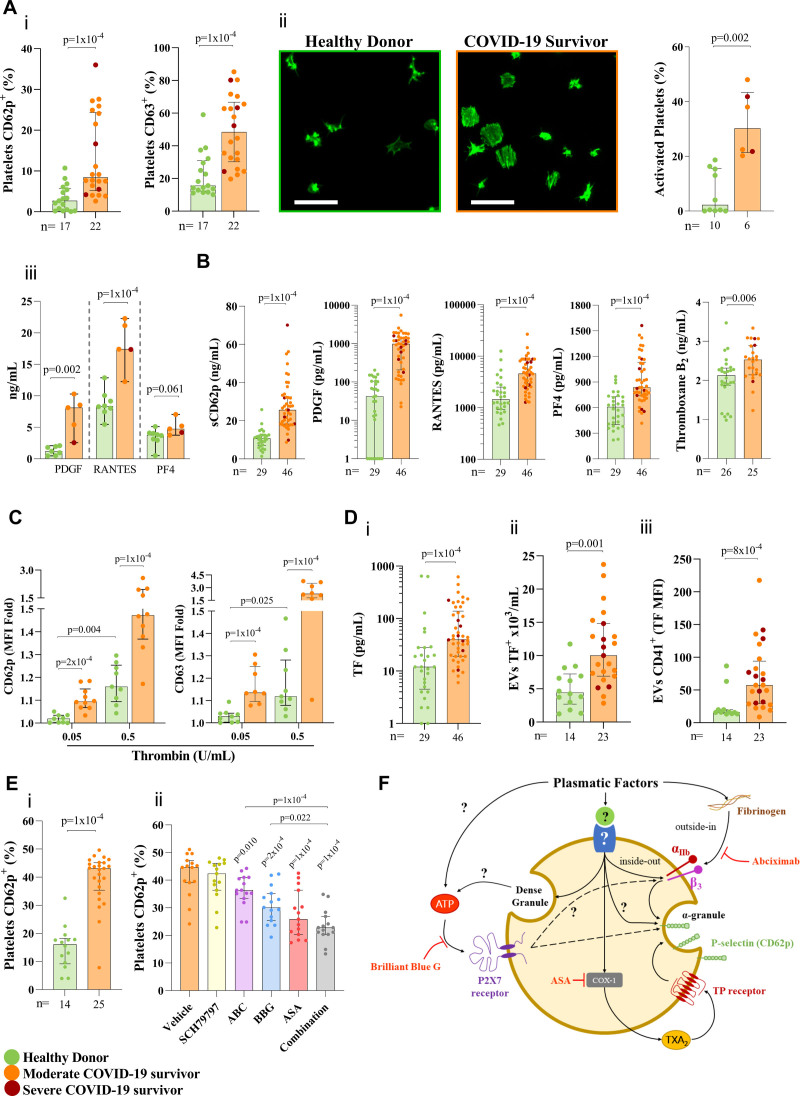
Persistent platelet activation in COVID-19 survivors. A, Platelet activation. (i) Percentage of platelets expressing CD62p and CD63 assessed by flow cytometry. (ii) Quantification of platelets spreading (stained with Alexa-488-phalloidin) over a fibrinogen coating and images that better represent the median of the results. Bars: 20 µm. Quantifications were performed in images of 3 different fields with at least 60 platelets each, taken by an investigator blinded to experimental groups. (iii) Spontaneous ex-vivo release of α-granule products by platelets incubated for 30 min at 37°C. B, Quantification of platelet-derived factors in the plasma. sCD62p, PDGF, RANTES, PF4, and Thromboxane B2 assessed through ELISA. C, Platelet hyperreactivity in COVID-19 survivors. MFI-fold increase of CD62p and CD63 labeling after stimulation with thrombin (0.05 or 0.5 U/mL). D, Procoagulant extracellular vesicles (EVs) in COVID-19 survivors. (i) Concentration of plasmatic TF. (ii) Concentration of circulating TF-bearing EVs. (iii) MFI of TF labeling in platelet-derived TF-bearing EVs. E, Ex-vivo platelet activation mechanisms. (i) Percentage of healthy donors’ platelets expressing CD62p after 1 h incubation with COVID-19 survivors’ or heterologous healthy donors’ plasma. (ii) Percentage of healthy donors’ platelets expressing CD62p after 30 min of pretreatment with SCH79797 (5 µM), Abciximab (ABC-50 µg/mL), Brilliant Blue G (BBG-5 µM), acetylsalicylic acid (ASA-100 µM), or their combination followed by incubation with COVID-19 survivors’ plasma. F, Schematic representation of platelet activation mechanisms in COVID-19 survivors. Inside-out signaling primes integrins αIIb and β3 for interaction with fibrinogen resulting in α-granule release. ATP released from dense granules in an autocrine/paracrine manner induces α-granule release through P2X7R purinergic signaling. Thromboxane A2 synthesis though COX-1 promotes autocrine activation of TP receptor, leading to α-granule release. Values are represented as the median with interquartile range. Normality was assessed using the Shapiro-Wilk test. Comparisons between 2 groups were performed using the Student t test and the Mann–Whitney U test for parametric and nonparametric distributions, respectively. One-way ANOVA followed by Tukey post hoc test was used to compare differences among 3 groups following a parametric distribution. All statistical analyses were performed using GraphPad Prism version 9.4.1. TF indicates tissue factor.

