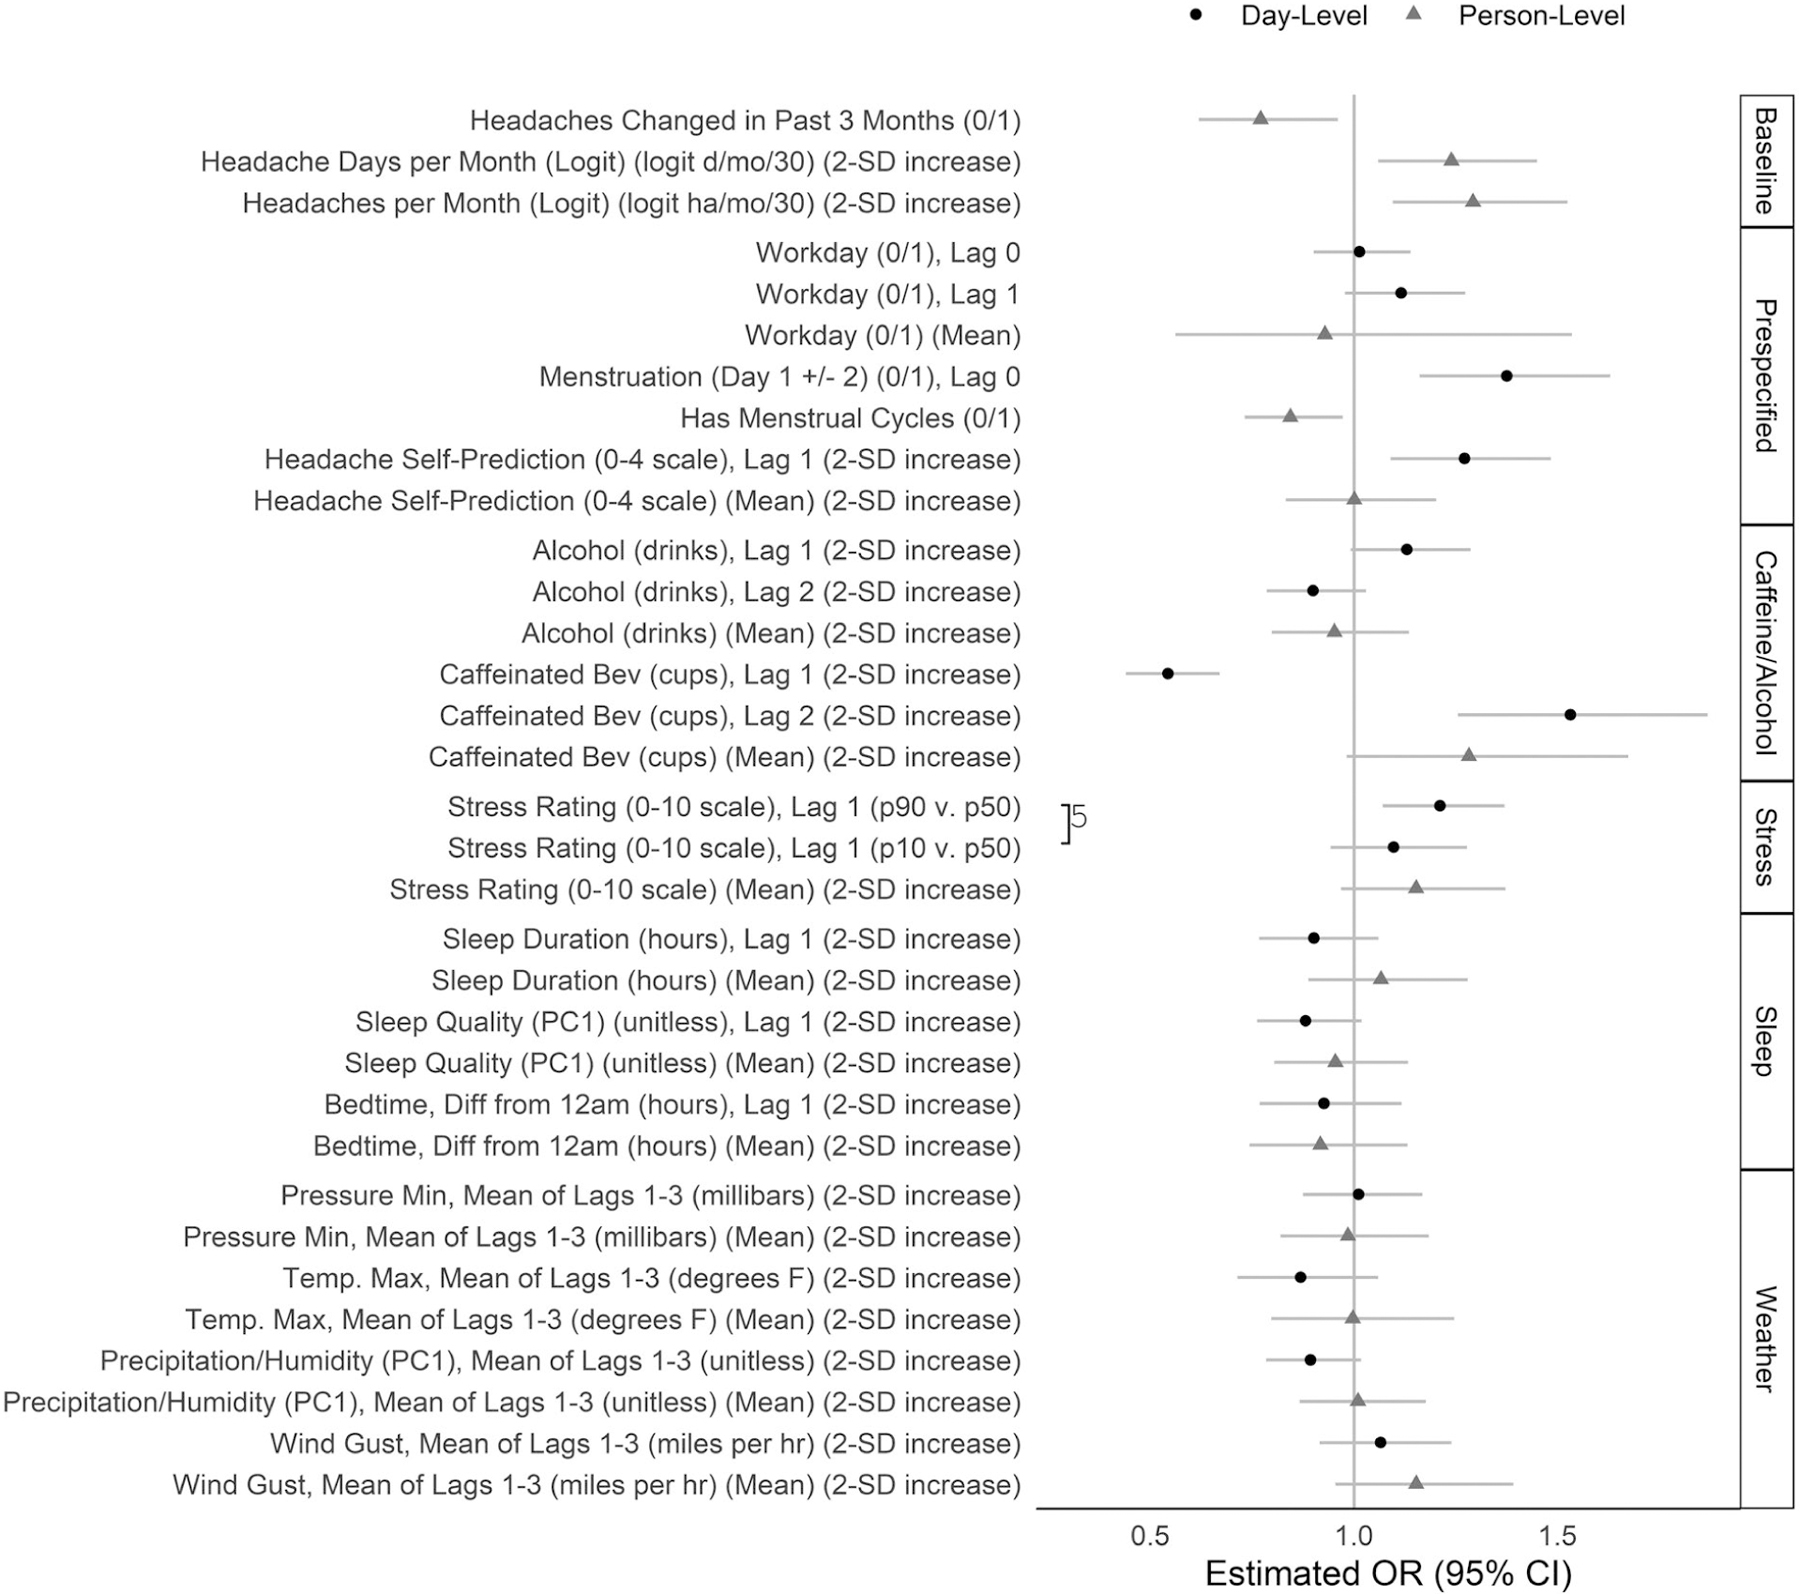
Fig. 3.—

Coefficient estimates from the primary model. The coefficients and 95% Wald confidence intervals were estimated in the primary multilevel logistic regression model for migraine risk including all 34 predictors shown here plus an intercept. Predictors were measured at the day level (varying across persons and across days within persons) (black) or the person level (varying across persons, but constant across days within persons) (gray). Lag 0 denotes the day for which migraine risk is predicted; lag 1 denotes the day before, and lag 2 denotes 2 days prior. Predictors modeled by 3-knot natural cubic splines were represented in the model by 2 separate linear terms and are shown in this plot by 2 separate estimates to summarize the nonlinear relationship: odds ratios for the 90th vs 50th, and 50th vs 10th percentiles of the overall distribution of the predictor. On this plot, these pairs of terms are connected by a “]” with an integer denoting the number of imputations (of 5) in which the pair of linear terms was jointly statistically significant. The data for this plot are given in Table S4.
