
Figure 5.
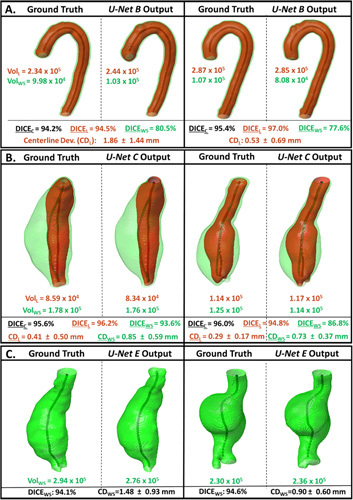
Model predictions of the thoracic (A) and abdominal (B) aortic regions from CTA images and the abdominal region from noncontrast CTimages (C) within the testing cohort are displayed alongside labelled GT masks. WS and Lumen volumes, when available, are indicated next to each segmentation. DICE scores for the lumen (black), WS (grey), and the combined aortic predictions are indicated for each patient. The difference in centerlines derived from the lumen (CDL +/– SD) and wall structure masks (CDWS +/– SD) are indicated as average Euclidean distance deviation. CDL indicates Centerline Deviation of Lumen;SD, Standard Deviation.