
Figure 7.
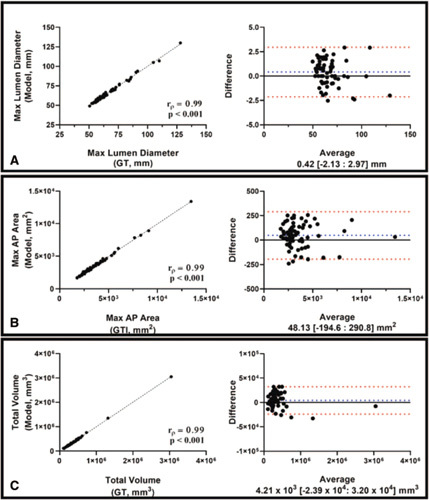
Bl and-Altman plots and correlation-coefficient analysis comparing the 1-D (Max AP Diameter of AAA - A), 2-D (Max axial area of AAA - B), and 3-D (Total volume of AAA - C) measurements from model predictions compared against those derived from GT. This analysis was limited to volumes extracted from noncontrast CT images. Spearman correlation coefficients (r p) and P-values are indicated on the graphs.