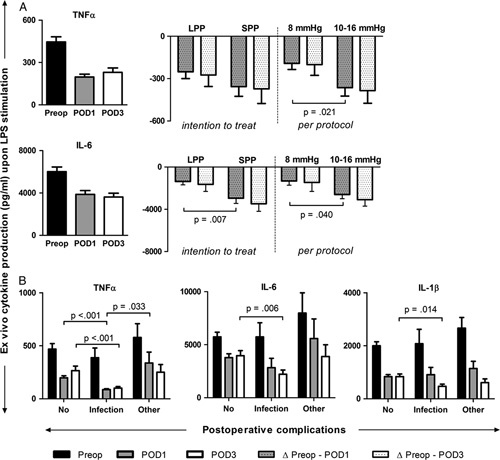
FIGURE 3.

A, Ex vivo cytokine production capacity upon whole blood endotoxin stimulation and the effects of LPP for LPP and SPP (intention to treat, n=50 vs n=49) and 8 and 10 to 16 mm Hg (per-protocol, n=35 vs n=64). B, Ex vivo cytokine production (TNFα, IL-6, and IL-1β) for patients with no complications (n=73), infectious complications (n=15), and other complications (n=12). Data are represented as mean±SEM. Preop indicates preoperative.
