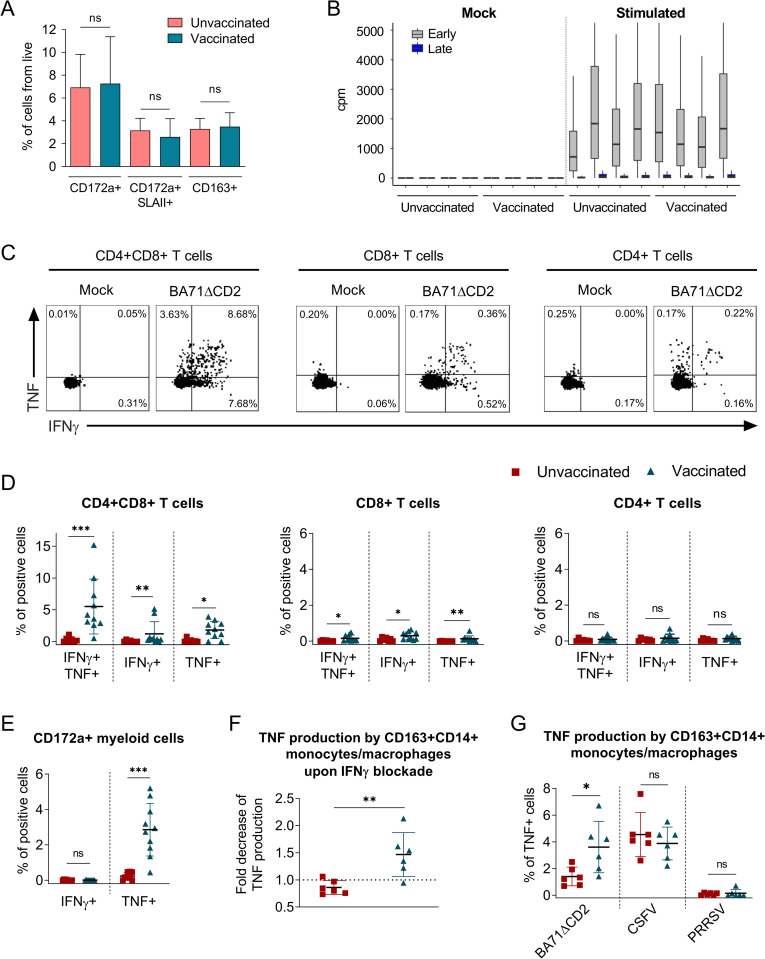
Fig 4. IFNγ from ASFV-specific CD4+CD8+ T cells induces TNF-production by myeloid cells.
(A) Percentage of myeloid cells (CD3-CD172a+) and monocytes/macrophages (CD3-CD172a+SLAII+ or CD3-CD163+) in PBMC from unvaccinated (n = 5) and BA71ΔCD2-vaccinated (n = 7) pigs assessed by flow cytometry. (B) RNA-seq-derived number of reads mapping to early and late ASFV genes in PBMC after 10 hours stimulation with mock or BA71ΔCD2 ASFV. (C) Representative dot plots for intracellular IFNγ and TNF staining on T cells from a vaccinated pig. (D-E) Percentages of IFNγ- and/or TNF-producing CD4+CD8+, CD8+ and CD4+ T cells (D) or myeloid cells (CD3-CD172a+) (E) in PBMC from unvaccinated (n = 7–8) and vaccinated (n = 10) pigs after mock or BA71ΔCD2 stimulation. (F) Fold decrease of TNF production by monocytes/macrophages (CD3-CD14+CD163+) in BA71ΔCD2-stimulated PBMC from unvaccinated (n = 6) and BA71ΔCD2-vaccinated (n = 6) animals treated or untreated with anti-IFNγ antibody. The fold decrease was calculated by dividing percentages of TNF-producing cells without IFNγ blockage by percentages of TNF-producing cells with IFNγ blockage. (G) Percentages of TNF-producing monocytes/macrophages (CD3-CD14+CD163+) in PBMC from unvaccinated (n = 6) and BA71ΔCD2-vaccinated (n = 6) animals upon stimulation with BA71ΔCD2, CSFV or PRRSV. Statistical significance was determined by unpaired two-tailed t-test for normally distributed data, or two-tailed Mann-Whitney U test for not normally distributed data, and is displayed in GraphPad style (p > 0.05 ns, * p ≤ 0.05, ** p ≤ 0.01, *** p ≤ 0.001).

