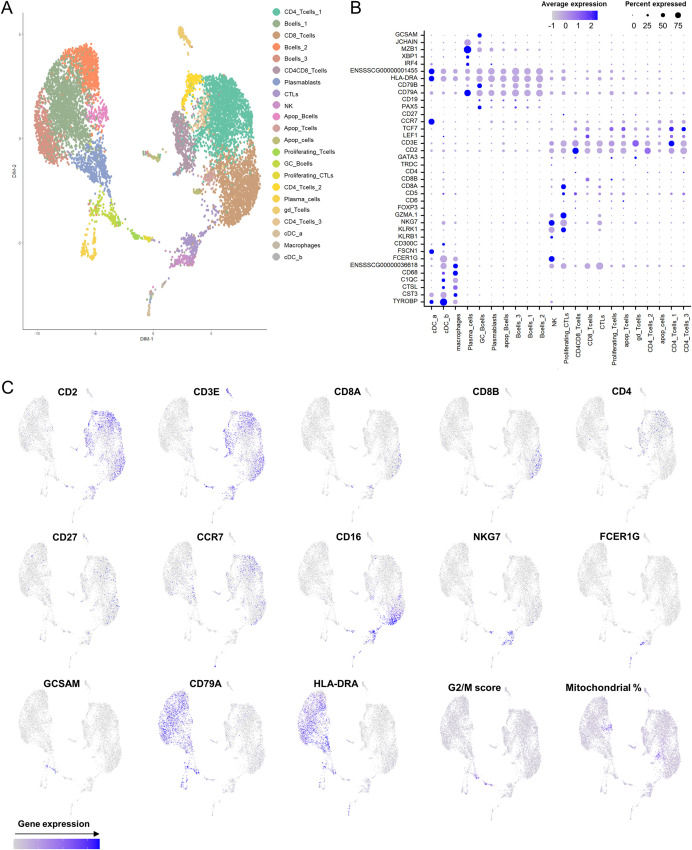
Fig 5. Classification of scRNA-seq clusters from porcine submandibular LN cells.
(A) Uniform Manifold Approximation and Projection (UMAP) plot representing 22 transcriptionally distinctive clusters, each one differently colored. (B) Dot plot visualization of selected marker genes in each cluster. Dot size represents the percentage of cells expressing the particular gene, while the spectrum of color indicates the mean expression levels. ENSSSCG00000001455 = SLA-DRB1, ENSSSCG00000036618 = FCGR3A. (C) Feature plots depicting single-cell expression of key cluster-defining genes.

