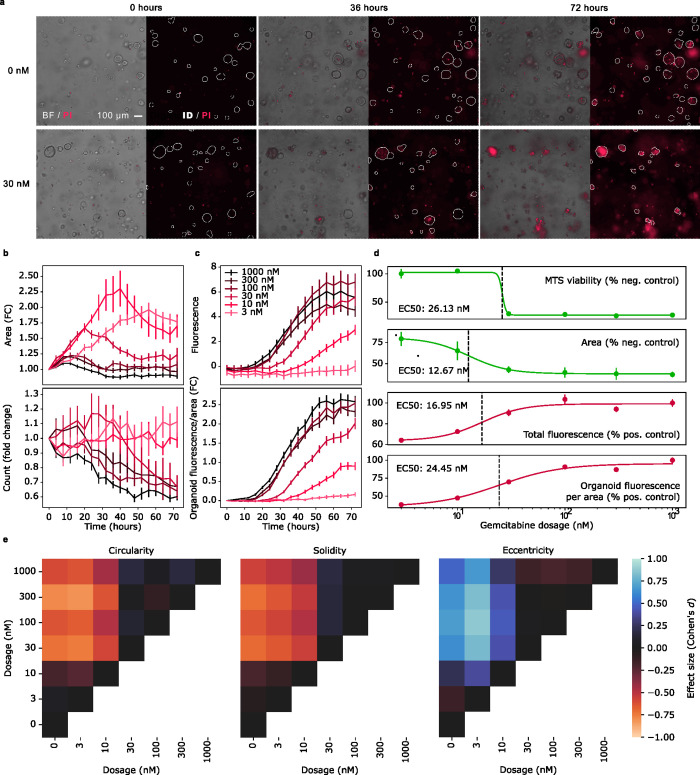
Fig 3. OrganoID facilitates morphological analysis of a chemotherapeutic dose-response experiment.
(a) PDAC organoids were treated with a serial dilution of gemcitabine (3 nM to 1,000 nM) and imaged over 72 hours. Propidium iodide (PI) was used to fluorescently label dead organoids. Shown are representative brightfield images from three time points for control and 30 nM gemcitabine conditions. OrganoID was used to identify organoid contours, which are displayed on top of the PI fluorescence channel. (b) OrganoID measurements of fold change (FC) organoid area (top) and number of organoids (bottom) over time for each concentration of gemcitabine. Measurements were normalized to the initial timepoint. Error bars represent standard error of the mean (n = 6). (c) Total PI fluorescence intensity above control for each concentration of gemcitabine (top). The fluorescence intensity per area of each OrganoID-identified and tracked organoid were then normalized to the timepoint of first detection, which improved separation of responses to difference concentrations of gemcitabine and reduced standard error across replicates (bottom). (d) An MTS assay was used as a gold standard measurement of viability to compute the half-maximal effective concentration (EC50) at the end of the experiment. Organoid area, total fluorescence, and area-normalized fluorescence were also measured at endpoint to produce dose-response curves and estimate EC50 without the need for live-cell staining. (e) Descriptive shape measurements, including circularity (the inverse ratio of organoid perimeter to the perimeter of a perfect circle with equivalent area), solidity (the ratio of organoid area to its convex hull), and eccentricity (elliptical deviation from a perfect circle), were computed for each organoid. The effect size (Cohen’s d statistic) between each gemcitabine concentration is shown. Effect size is computed from dosages on the x-axis to dosages on the y-axis.

