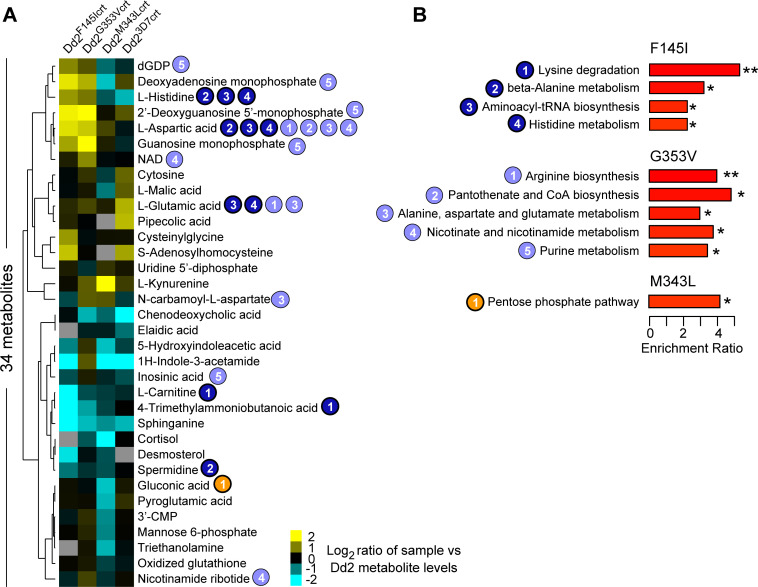
Fig 4. Detected metabolites and pathways altered in PPQ-resistant mutant pfcrt lines.
(A) Heatmap of 34 metabolites identified in at least 3 of the 4 isogenic Dd2 lines differing in their PfCRT isoform, with metabolite levels expressed as a log2 ratio for each line compared to Dd2 (aggregated group of Dd2 and Dd2Dd2crt). Undetected metabolites are indicated in grey. Numbers correspond to pathways shown in (B). (B) List of KEGG metabolic pathways showing significant differences in metabolite abundance for each mutant line compared with the aggregated Dd2 data (*p<0.05; **p<0.01; Q-statistic calculated from a generalized linear model).

