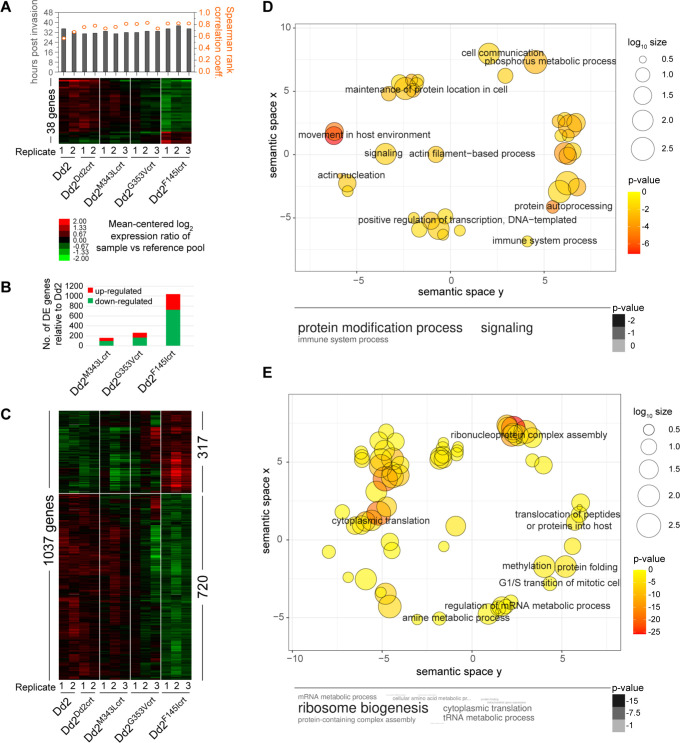
Fig 5. Differential gene expression in PPQ-resistant and PPQ-sensitive PfCRT variants.
(A) Mean-centered hierarchically clustered heat map of 38 genes that exhibit differential expression between the four isogenic Dd2 parasites (N = 3–4; one-way ANOVA with permutation p<0.05). Bars and scatter points, shown above, depict the mapped parasite stage (in hr post-invasion) and the Spearman rank correlation coefficient of each sample, as determined against the 48 hr Dd2 reference transcriptome, respectively. (B) Total number of differentially expressed genes for each mutant line relative to the aggregated group of Dd2Dd2crt and Dd2 parasites (N = 3–4; Student t-tests with permutation p<0.05). (C) Mean-centered hierarchically clustered heat map analysis of 1037 genes that exhibit differential expression between the Dd2F145Icrt and the aggregated Dd2 parasites (N = 3–4; Student t-tests with permutation p<0.05). (D, E) Significantly enriched pathways in the (D) 317 up-regulated and (E) 720 down-regulated genes observed in the Dd2F145Icrt line relative to the aggregated Dd2 parasites (p<0.05). Pathways were identified using Gene Ontology (GO) enrichment of computed and curated biological processes and visualized by REVIGO to obtain representative pathways. The colors indicate the p value of each GO term and size indicates the frequency of the GO term in the P. falciparum database. Listed p values are to the power of 10.

