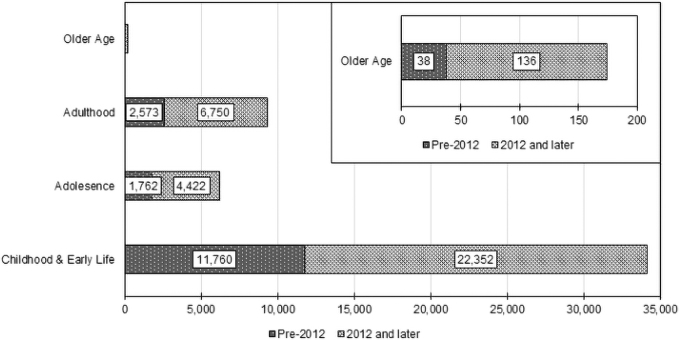
FIG. 2.
The main graph illustrates the average number of search results from each database using each age group search criteria (1) pre-2012 and (2) 2012 and later (i.e., after Mukaetova-Ladinska et al.'s study). The inset graph illustrates the number of older age search results with a reduced axis scale.

