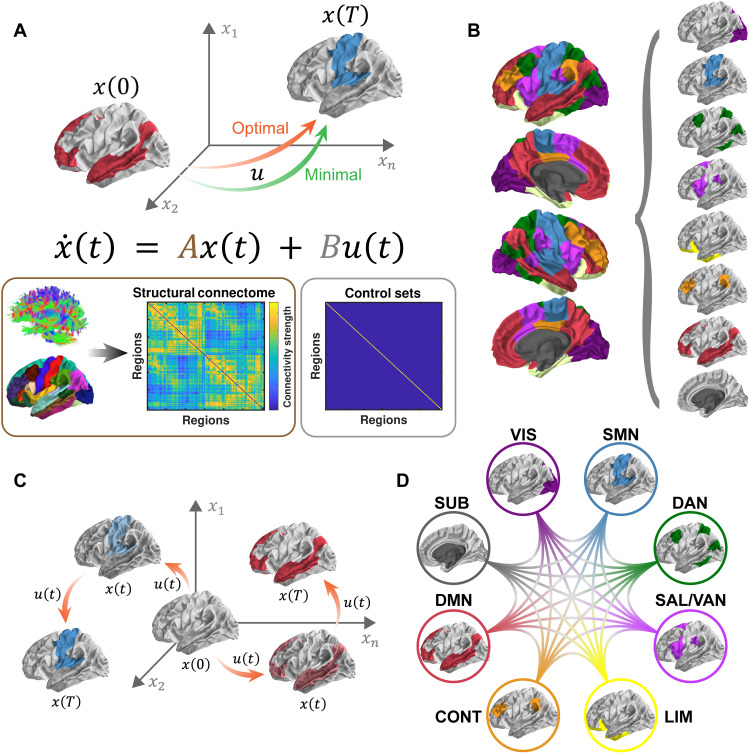
Fig. 1. Schematic of methods.
(A) On the basis of a simplified noise-free, linear, continuous-time, and time-invariant model of neural dynamics, we simulate energetic processes during brain state transitions instantiated upon and constrained by the structural connectome (matrix A). Two types of control energy (a quadratic function of u) are depicted: the minimal control energy (MCE) required to drive the brain from an initial state [x(0)] to a final state [x(T)] using a specific set of control nodes (whole brain, matrix B) and the optimal control energy (OCE) additionally constrains the length of the trajectory between states. (B) Eight preferential brain states are defined according to the known ICNs (37, 38). Within each state, regions from a specific ICN are activated at a magnitude of 1, whereas the rest of the brain remains at 0 (inactivated). These preferential brain states constitute the initial and final states of our simulations. (C) We then simulate the energetic inputs required to activate each of the preferential brain states from a theoretical baseline (i.e., activity magnitude of 0). Next, we estimate the OCE consumed during each of the activation processes across the whole brain for each individual. (D) We also simulate transitions between preferential brain states and estimate the MCE consumed at each brain region for each individual. VIS, visual network; SMN, somatomotor network; DAN, dorsal attention network; SAL/VAN, salience/ventral attention network; LIM, limbic network; CONT, executive control network; DMN, default mode network; SUB, subcortical network.

