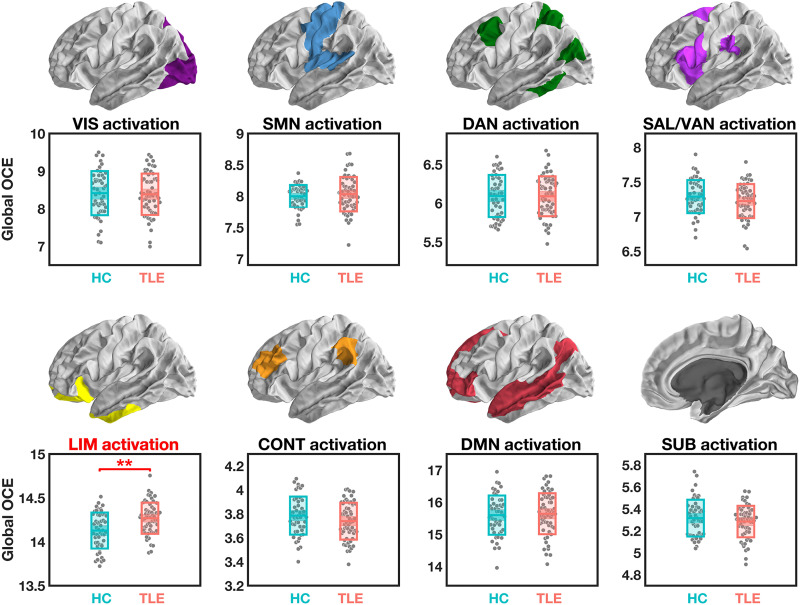
Fig. 2. Global OCE estimated during simulated activation of ICNs.
After correction for multiple comparisons, significant group differences were only found for the simulated activation of the LIM, which demanded more global OCE in patients with TLE compared to HCs. **Pcorr < 0.01. The central mark indicates the median, and the bottom and top edges of the box indicate the 25th and 75th percentiles, respectively.

