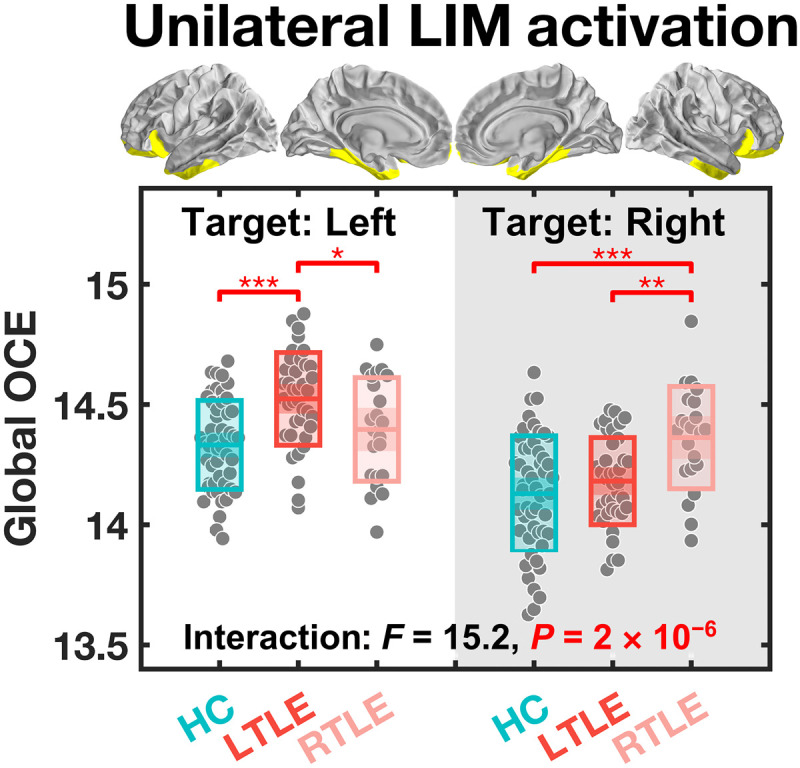
Fig. 3. Global OCE estimated during a simulated transition from the baseline to a final state where only one side of the LIM is activated.

When the target was set to the left hemispheric LIM, only patients with left TLE (LTLE) needed more energy than the other two groups. When the target was set to the right hemispheric LIM, only patients with right TLE (RTLE) needed more energy than the other two groups. *PBonferroni < 0.05, **PBonferroni < 0.01, and ***PBonferroni < 0.001. The central mark indicates the median, and the bottom and top edges of the box indicate the 25th and 75th percentiles, respectively.
