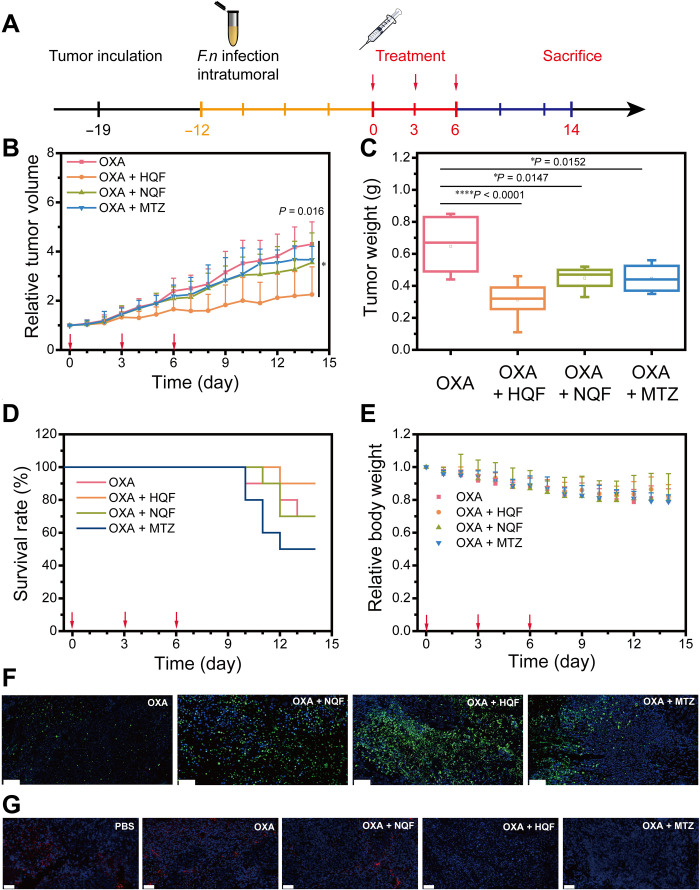
Fig. 7. Anticancer effects in subcutaneous tumor model.
(A) Schematic illustration of tumor inoculation and treatment protocol for the HCT116 tumor-bearing mice. (B) Tumor growth curve in each group: (i) intraperitoneal injection of OXA (7.5 mg/kg), (ii) intraperitoneal injection of OXA (7.5 mg/kg) and then peritumoral injection of NQF solution, (iii) intraperitoneal injection of OXA (7.5 mg/kg) and then peritumoral injection of HQF assemblies, and (iv) intraperitoneal injection of OXA (7.5 mg/kg) and then oral administration of MTZ (200 mg/kg). (C) Tumor weight in each group. (D) Survival rate curve in each group. (E) Quantification of relative body weight in each group. (F) Representative TUNEL staining examination results of the dissected tumors. (G) Representative FISH staining to visualize F. nucleatum in tumor tissue sections. Scale bars, 50 μm. All the data were presented as means ± SD, while n = 10. Red arrows in (B), (D), and (E) indicated the day of treatment. The significance was evaluated by one-way ANOVA test in (B) and (C). *P < 0.05; ****P < 0.0001.

