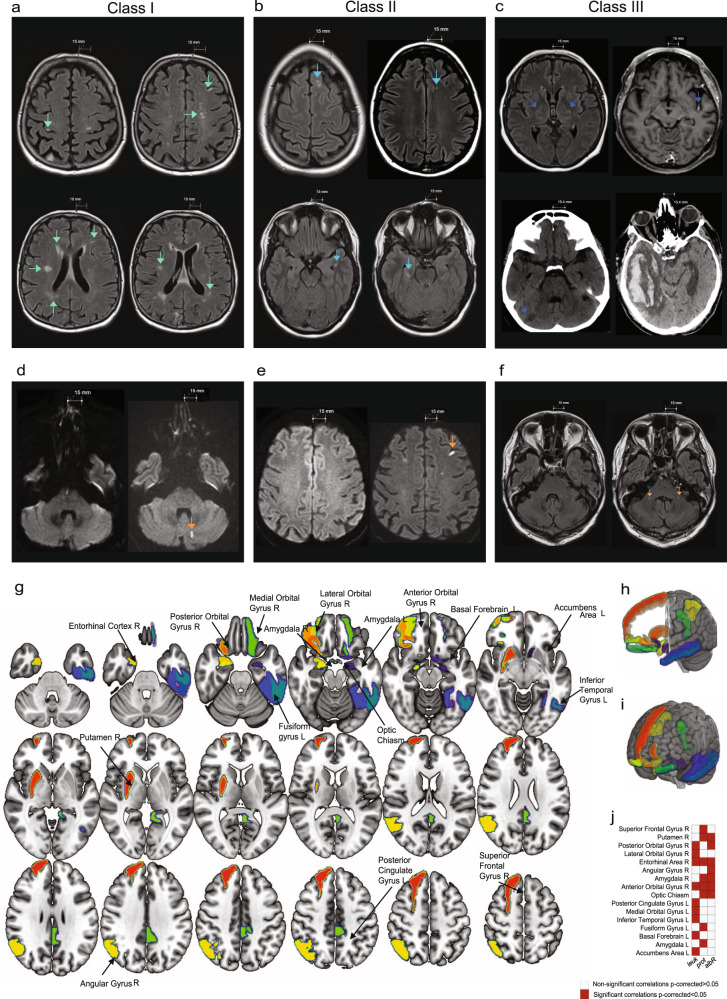
Fig. 7. Routine brain imaging, regional GMVs and association with inflammatory CSF parameters.
a–c Conventional brain MRI and CT scans depicting exemplary imaging findings. Scale bar 15 mm (MRI) and 15.4 mm (CT). a Class I: Axial FLAIR images of the same class I patient show multifocal hyperintensities in the right precentral gyrus (top left), semioval center, left frontal cortex (top right), deep white matter, periventricular region (bottom left), right temporal lobe, left parietal white matter (bottom right). b Class II: Axial FLAIR images of a class II patient depict multifocal hyperintensities in the left frontal superior gyrus (top left), white matter of left frontal lobe (top right), left parahippocampal white matter (bottom left), right mesial temporal region (bottom right). c Class III: Axial FLAIR image shows bilateral thalamic hyperintensities (top left). Axial T1-weighted image depicts left middle cerebral artery (M2-segment) enhancement in the insular cistern (top right). Coronal CT scans demonstrate right cerebellar infarction (bottom left) and right temporo-occipital intracerebral hemorrhage (bottom right) (secondary to thrombosis of the right sigmoid sinus). d–f Conventional pre-COVID-19 MRIs (left) and MRIs during COVID-19 (right). d, e Axial DWI of the same class I patient depicts hyperintense signal alterations during COVID-19 (right sided MRI scans, orange arrows) in the left cerebellar hemisphere (d) and frontal juxtacortical region (e). f Axial FLAIR imaging demonstrates bilateral hyperintense signal alterations in the cerebellar peduncles (right sided MRI scan, orange arrows) of a class III patient. g–i Map (g) and 3D view (h, i) of the 16 brain regions with significant correlation values of gray matter volume (GMV) and clinical variables in the Neuro-COVID group after multiple comparison correction (FDR). These regions are represented in different colors on a T1-weighted template. j shows a matrix representing the association significance (significant p-corrected <0.05 in red squares). Associations between regional volumes and clinical measures were assessed using partial correlation, allowing to calculate the linear partial correlation between variables of interest adjusting for different covariates (age, sex, age*sex interaction, MRI magnetic field strength, total intracranial volume (TIV)). Statistical analysis was performed using the JASP software (https://jasp-stats.org/). MRIcroGL software was used to generate this figure (https://www.nitrc.org/projects/mricrogl). Source data of (g–j) are provided as a Source Data file. L left, R right, leuk leukocytes, prot protein, albR Albumin CSF-plasma ratio.

