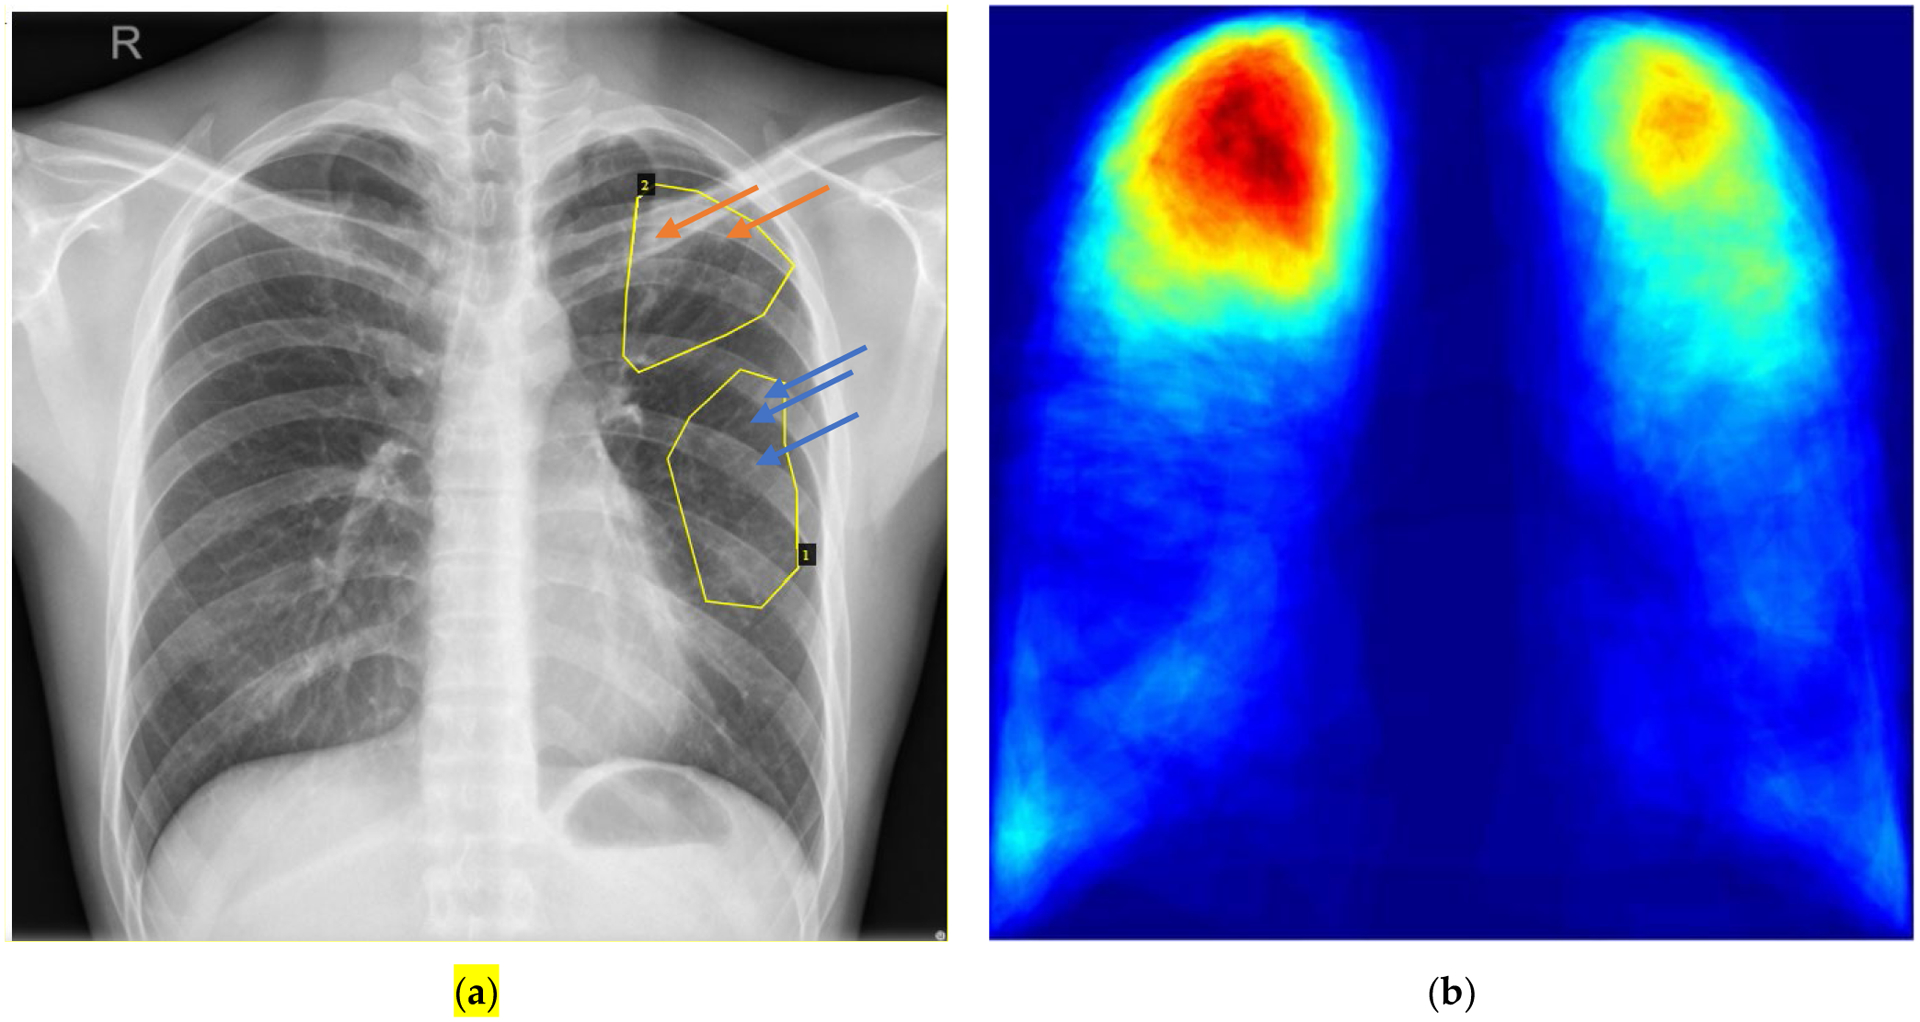
Figure 1.

Annotation visualization and a representative heatmap generated from all annotations. (a) Visualization of annotations for CHNCXR_0327_1.png by VIA2. Two steps are needed to visualize annotations in JSON format: 1) load a CXR image via “Add Files” in the left column of the webpage; 2) load the corresponding annotation with “Annotation->Import Annotations (from json)” from the top bar. There are two abnormal areas in this CXR image. Their types are shown when clicking with the mouse on their corresponding areas. Area 1 includes clustered nodules (2mm-5mm apart) (indicated by blue arrows) and Area 2 is with calcified nodules (indicated by orange arrows). (b) Representative heatmap of all 19 finding categories compatible with TB. It is of no surprise to clinicians that the right upper lobe is most involved (due to the more vertical nature of the bronchus intermedius on the right relative to the left mainstem bronchus), followed by left upper lobe. Similar right sided predominance is supported by increased involvement of right costophrenic angle and supportive findings expected with TB distribution.
