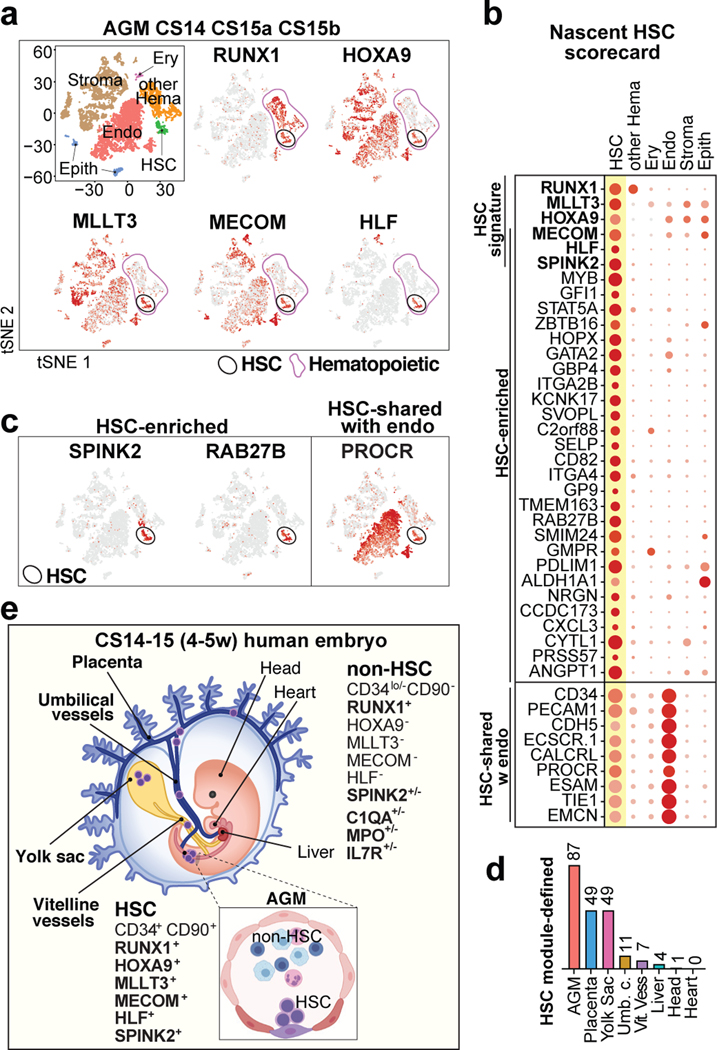
Figure 1: HSC molecular signatures identifies nascent human HSCs.
(a) Single-cell RNA-sequencing analysis of CD34+ and/or CD31+ enriched cells from the AGM region of human embryos (n=3 biologically independent samples: week 4.5/CS14, week 5/CS15a, week5/CS15b). Cells are plotted in tSNE and categorized by cell type. Clusters with hematopoietic cells (RUNX1+/CD45+) and HSCs (cluster 12) are circled in purple and black, respectively. Feature plots identify HSCs by co-expression of HSC transcriptional regulators. (b) Dot plot featuring the nascent HSC scorecard, which includes genes significantly enriched in HSC cluster compared to all other clusters (in a), and all other hematopoietic cells (in ED Fig.1j) (expressed in <25% of cells in other populations, adj. p-value <0.0001, Wilcoxon rank-sum test). Selected HSC genes that show endothelial cell expression are also included. (c) Feature plots of HSC-enriched genes SPINK2 and RAB27B, and PROCR, shared with HSC and endothelial cells. (d) Quantification of module-selected HSCs in intra- and extraembryonic tissues in 4.5 weeks/CS14 conceptus. (e) Model scheme depicting nascent HSCs in the AGM and extraembryonic tissues in CS14–15 (4.5–5 weeks) embryos. HSC molecular signature distinguishes nascent HSCs from progenitors and differentiated cells. Partially created with BioRender.com.

