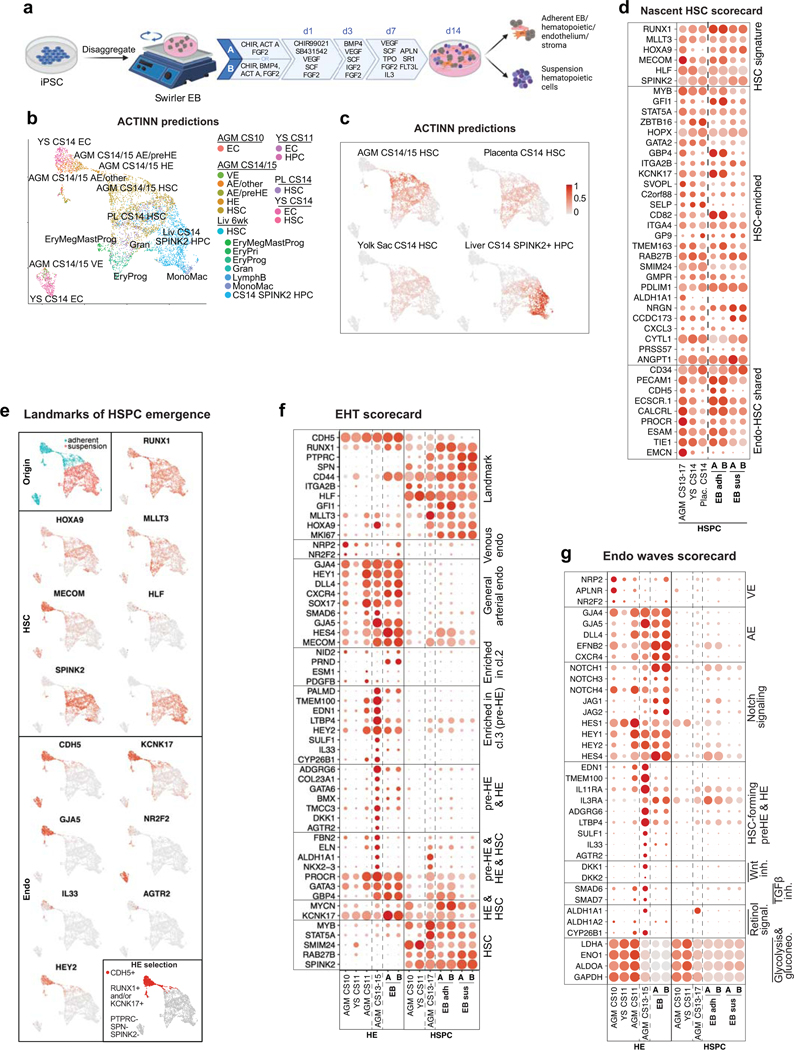
Extended Data Fig.9: Mapping PSC-derived hematovascular cells to human HSC ontogeny.
(a) Schematic depicting protocols A or B for hPSC differentiation using swirler EB method and different cytokine combinations that generate adherent and suspension fractions at day 14. Created with BioRender.com. (b) UMAP plot showing strongest ACTINN matches for PSC-derived CDH5+ and/or RUNX1+ cells. (c) Feature plots depicting ACTINN probability scores for different cell identities in PSC-derived CDH5+/RUNX1+ cells. (d) Dot plot showing “Nascent HSC scorecard” genes in PSC-derived SPINK2+HLF+ HSPC. (e) Upper left, UMAP plot showing the adherent and suspension fractions of PSC-derived CDH5+/RUNX1+ hematovascular cells. Feature plots displaying the expression of HSC genes (upper) and endothelial genes (lower) in PSC-derived CDH5+/RUNX1+ cells. Lower right, UMAP highlighting the selection of HE (CDH5+RUNX1+ and/or KCNK17+PTPRC-SPN-SPINK2-) in PSC-derived CDH5+/RUNX1+ cells. (f,g) Dot plots showing “EHT scorecard” genes (f) and “Endo waves scorecard” genes (g) in PSC-derived HE and HSPC from differentiation protocols A and B, compared to their in vivo counterparts.

