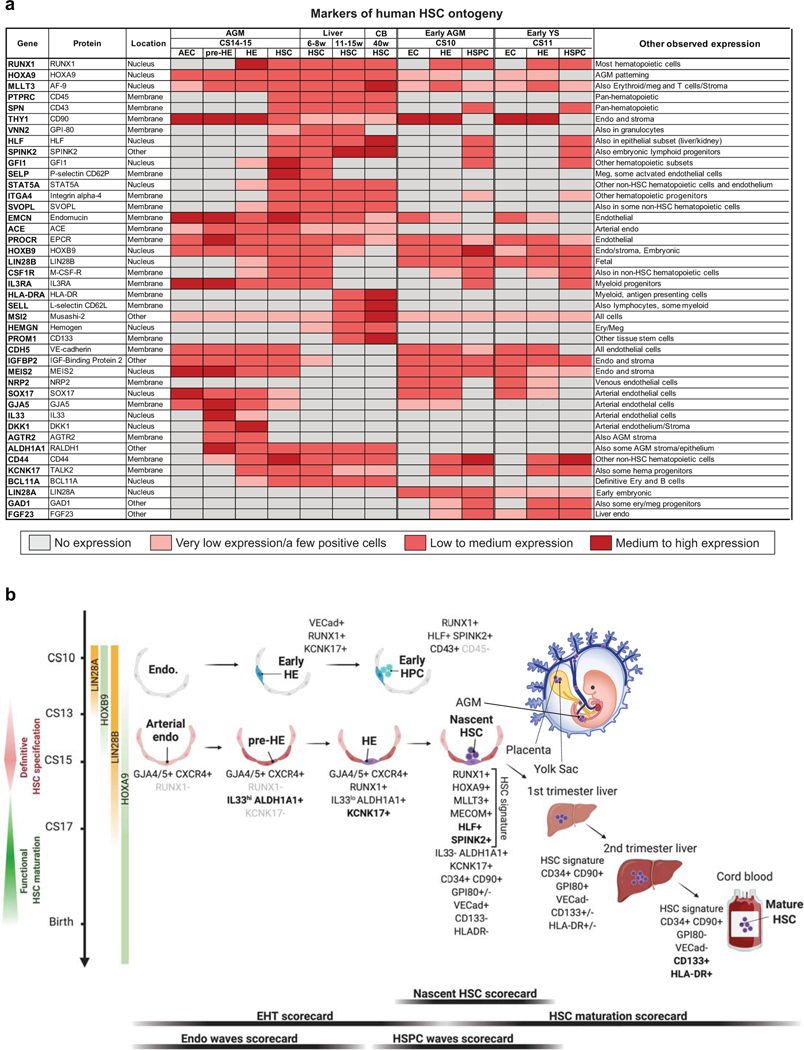
Extended Data Fig.10: Markers of human HSPC ontogeny.
(a) Summary table displaying patterns of gene expression for selected markers that distinguish different cell types and stages during human HSPC ontogeny. Color gradient from gray to dark red represents increase in gene expression levels and/or the frequency of positive cells within a population.
(b) A schematic displaying the key cell types, stages and markers involved in human HSPC specification, emergence, and maturation. Scorecards used to evaluate key stages of HSC development are shown below. Created with BioRender.com.

