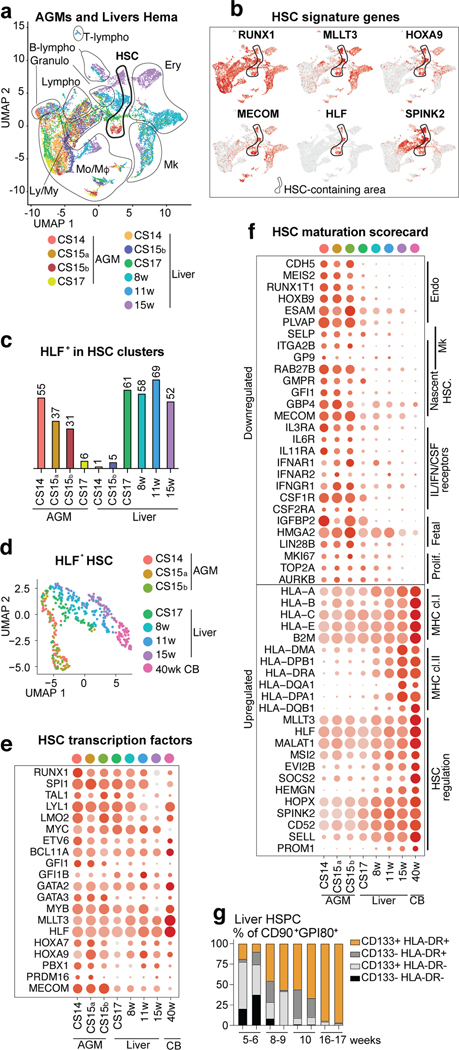
Figure 2: HSC developmental maturation associates with stage-specific molecular programs.
(a) scRNA-seq analysis of four AGM tissues (CS14-CS17) and six livers (CS14 to week 15) from eight concepti (n=10 biologically independent samples). UMAP of hematopoietic clusters (RUNX1+/CD45+) combined from all tissues displaying hematopoietic cell types: HSC, Lympho-Myeloid (Ly/My), Monocyte/Macrophage (Mo/Mφ), Granulocyte (Granulo), Lymphoid, (T-Lympho, B-Lympho), Erythroid (Ery), Megakaryocytic (Mk) (b) Feature plots showing the expression of HSC molecular signature genes (HLF+ HSCs are circled). (c) Histogram showing HLF+ cells within HSC clusters in each tissue. (d) HLF+ HSC from tissues containing > 10 HSC, re-clustered and shown in UMAP analysis). (e) HSC transcription factor dot plot on HLF+ HSC from different tissues. Bars=500μm. (f) HSC maturation scorecard dot plot showing selected genes up- or down-regulated during HSC maturation. Bars=20μm. (g) Flow cytometry quantification of HSC maturation markers HLA-DR and CD133(PROM1) in fetal liver HSC (CD43+CD45midCD34+CD38low/-CD90+GPI-80+) at different stages is shown (n=2 biologically independent samples per stage).

