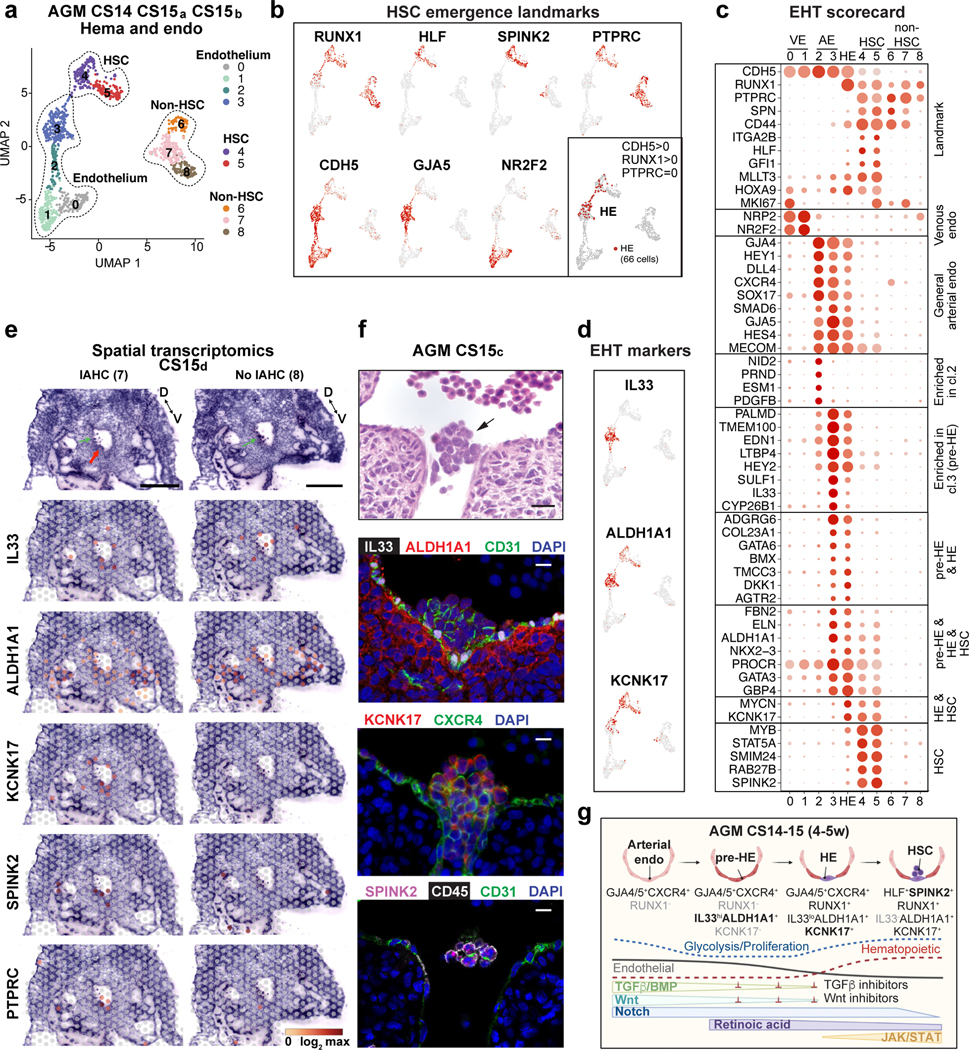
Figure 3: HSCs emerge from distinct arterial endothelial cells.

(a) UMAP analysis showing hemato-vascular populations (CDH5+ endothelium, RUNX1+HLF+ HSC and RUNX1+HLF- other hematopoietic cells) from CS14–15 AGM tissues (n=3 biologically independent samples). The contribution of cells in venous EC and non-HSC clusters was balanced. (b) UMAP feature plots displaying the expression of landmark genes for HSC emergence. HE was selected based on co-expression of RUNX1 and CDH5 and absence of PTPRC/CD45 (bottom, right; 66 cells). (c) “EHT scorecard” dot plot showing EHT landmark genes and genes co-regulated at different stages of EHT in each cluster (cl 0–8) and HE. Selected genes significantly enriched in HE compared to other populations, or up- or downregulated during transition to/from HE, were selected. (d) UMAP feature plots displaying pre-HE (IL33 and ALDH1A1) and HE (ALDH1A1 and KCNK17) markers. (e) Spatial transcriptomics of CS15d (5 weeks) embryo transverse sections. Upper panels, H&E staining of two sections between vitelline and umbilical arteries, focused on the dorsal aorta and surrounding region (red arrow: IAHC; green arrows: red blood cells, D=dorsal, V=ventral, bars=500μm). Lower panels showing the spatial expression of EHT genes, with the default color scale from Loupe browser, which represents the log2 expression from 0 to the maximum value in the spots. Each dot is 55 μm and shows combined expression of 1–10 cells. (f) H&E section (section #240) of CS15c (5 weeks) aorta at the intersection with vitelline artery (arrow: IAHC). Immunofluorescence staining of aorta for IL33, ALDH1A1, CD31 and DAPI (section #251), CXCR4, KCNK17 and DAPI (section #254) and SPINK2, PTPRC/CD45 and CD31/PECAM and DAPI (section #239). Bars=20μm. Individual antibody stainings were performed minimum three times in independent embryos with comparable staining pattern. (g) Schematic summarizing the model for EHT involving the specification of pre-HE and HE from arterial EC and HSC emergence. Stage-specific markers and signaling switches are shown. Created with BioRender.com.
