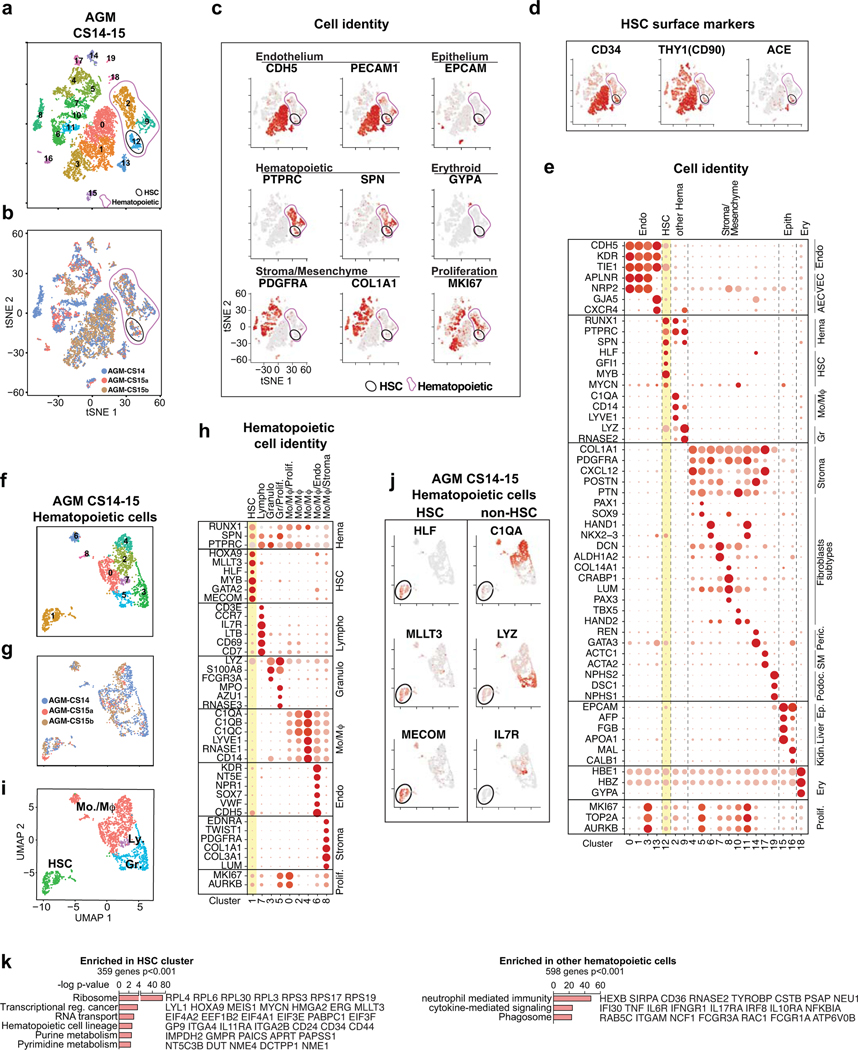
Extended Data Fig.1: Identification of cell types in the AGM region.
(a) Single-cell RNA-seq analysis of CD34+ and/or CD31+ enriched cells from CS14–15 AGM (n=3 biologically independent samples) (Fig.1a). tSNE plots show 20 clusters. Total hematopoietic cells (RUNX1+/CD45+, Clusters 2, 9, 12) and HSC (cluster 12) are circled in purple and black, respectively. (b) Contribution of each AGM sample to the clusters in (a). (c) Feature plots of cell type-specific genes documenting cell identities. (d) Feature plots showing co-expression of HSC surface markers in HSC cluster. (e) Dot plot with cell type-specific genes confirms cell identities in each cluster. (f) UMAP analysis showing reclustering of hematopoietic cells. (g) Contribution of each AGM to the clusters in (f). (h) Dot plot of lineage-specific genes showing the identity of hematopoietic cell types. (i) UMAP plot of hematopoietic cell types (HSC, Monocyte/macrophages-Mo/Mφ, Granulocytes-Gr, and Lymphoid cells-Ly. (j) Feature plots documenting the expression of HSC regulatory genes (left) and lack of lineage markers (right) in HSC cluster. (k) Gene ontology analysis of genes significantly enriched in HSC cluster vs other hematopoietic cells (Fisher’s exact test).

