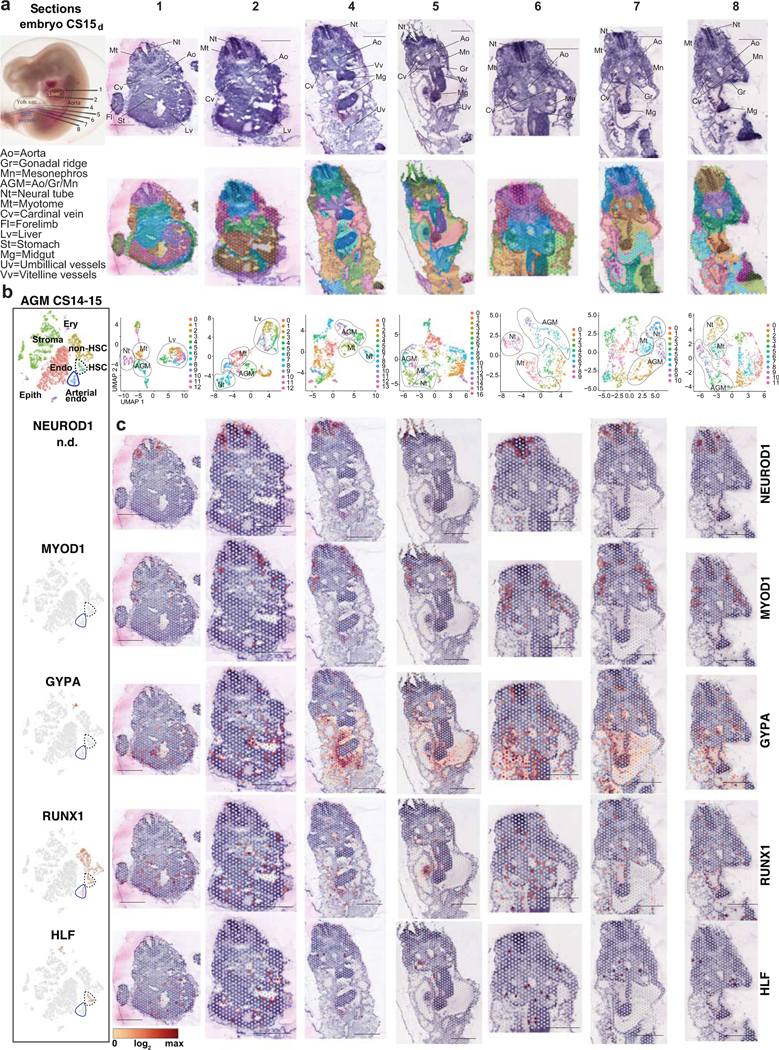
Extended Data Fig.5: Spatial transcriptomics of CS15 human embryo.

(a) CS15d/5 weeks human embryo processed for Visium Spatial transcriptomics and H&E stainings of seven transverse sections that were sequenced are shown, with key anatomical landmarks highlighted (top). Seurat cluster analysis is shown on the embryo sections (middle) and as UMAP plots (bottom). Bars=1mm. (b) tSNE plots of scRNA-seq data from the AGM region (CS14–15) documenting the main cell types and the expression of cell type-specific genes. (c) Spatial expression of landmark genes for neural tube (NEUROD1), myotome (MYOD), and hematopoietic cell types (GYPA for erythroid cells, RUNX1 for HE, HSPC and other hematopoietic cells, and HLF for HSC). Note HLF expression also in liver epithelium in ED Fig.2. The default color scale from Loupe browser was applied, which represents the log2 expression from 0 to the maximum value in the spots. Each dot is 55 μm and shows combined expression of 1–10 cells.
