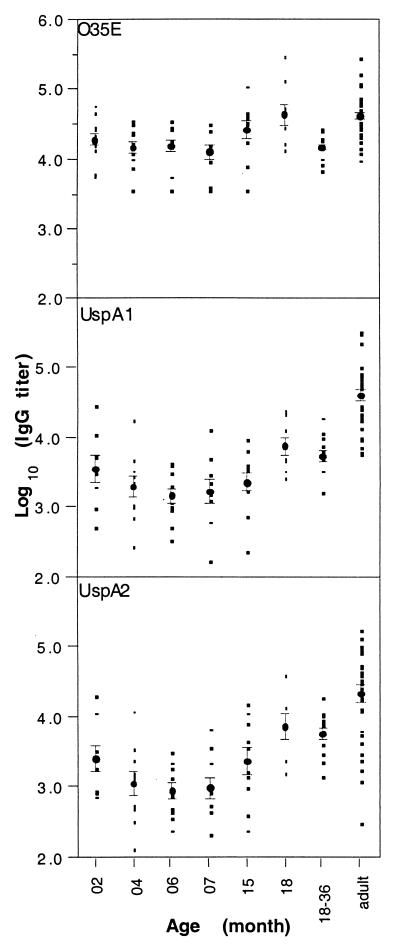
FIG. 1.
Levels of IgG to UspA1, UspA2, and M. catarrhalis O35E in normal children’s sera. The data plotted on the ordinate axis are log10-unit-transformed ELISA endpoint titers. The individual titers were plotted by age group. The geometric mean titers and the standard errors for each age group are indicated.

