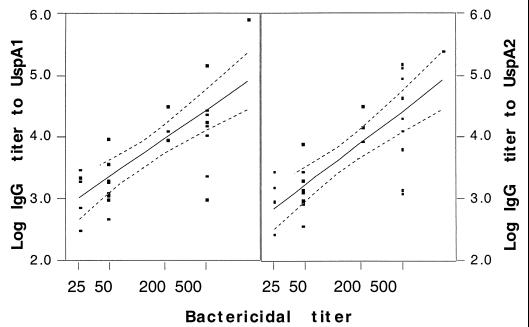
FIG. 4.
Relationship of serum IgG titers to UspA1 (left panel) and UspA2 (right panel) with the bactericidal titer against the O35E strain as determined by logistic regression (P < 0.05). The solid lines indicate the linear relationship between the IgG titer and the bactericidal titer. The broken lines represent the 95% confidence intervals of the linear fit.

