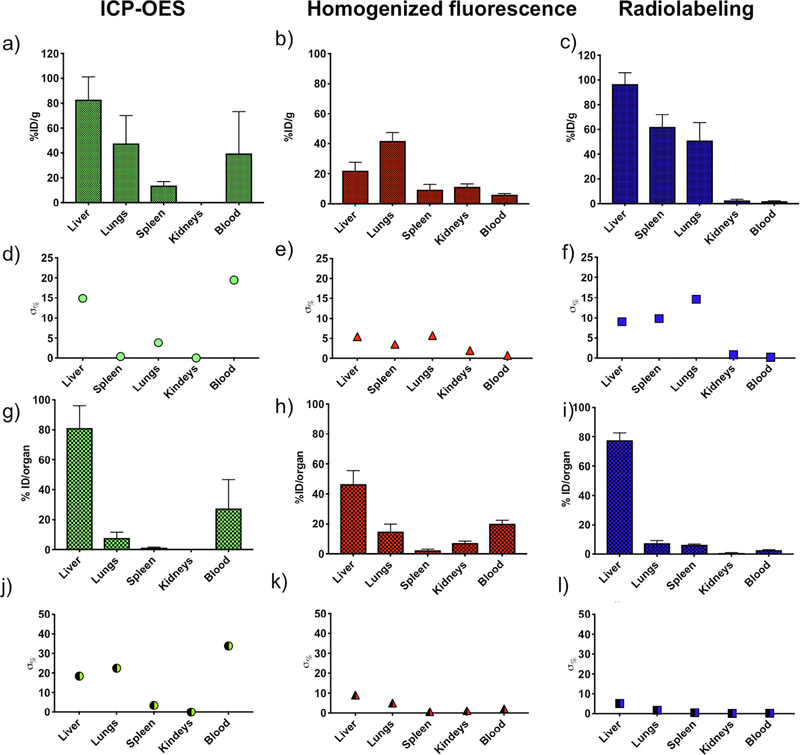
Fig. 6.
Comparison of biodistribution methods. Biodistribution is reported as %ID/g when such calculation is possible: a) ICP-OES, b) fluorescence of homogenized organs, and c) radiolabeling, with calculated percentage errors of d) ICP-OES, e) fluorescence, and f) radiolabeling. Biodistribution is reported as %ID/organ when such calculation is possible: g) ICP-OES, h) fluorescence of homogenized organs, and i) radiolabeling, with calculated percentage errors of j) ICP-OES, k) fluorescence, and l) radiolabeling. Results from N = 5 mice are presented as average per organ; error bars represent calculated standard deviation.

