FIG. 3.
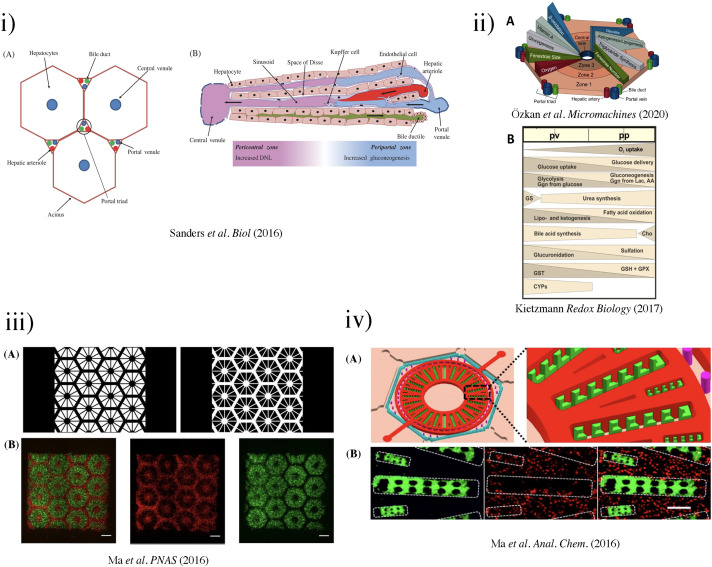
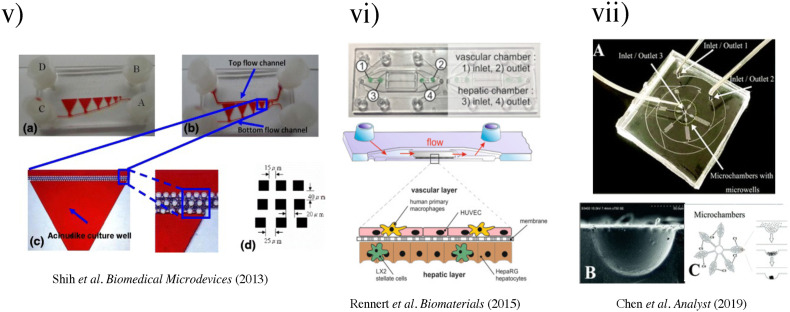
(i) The liver acinus and zonation of metabolic processes. (a) The gross cytoarchitecture of the hepatic parenchyma. (b) A cross section of liver tissue along the portocentral axis demonstrates the proposed zonation of metabolic processes, with the pericentral zone as the primary site of de novo lipogenesis (DNL) and the periportal zone as the primary site for gluconeogenesis. As indicated by the arrows, blood flows from the portal area via the sinusoid into the hepatic venule. Bile flows in the opposite direction from hepatocytes to the bile duct through the bile canaliculi.87 Reproduced with permission from Sanders et al. Biol. Rev. 91(2), 452–468 (2016). Copyright 2015 John Wiley & Sons Ltd on behalf of Cambridge Philosophical Society. (ii) (a) Biochemical pathways, gradients, and endothelial properties alternation across the zones of the liver lobule. Reproduced with permission from Özkan et al. Micromachines, 11(5), 487 (2020). Copyright 2020 MDPI.251 (b) Distribution of major metabolic pathways. (pp, periportal; pv, perivenous; AA, amino acids; Cho, cholesterol synthesis; CYP, cytochrome P450 enzymes; Ggn, glycogen; Lac, lactate; GPX, glutathione peroxidase; GS, glutamin synthesis; GST, glutathione transferase.)88 Reproduced with permission from Kietzmann et al., Redox Biology, Vol. 11. Copyright 2017 Elsevier B.V. (iii) (a) Grayscale digital masks corresponding to polymerizing lobule structure (left) and vascular structure (right) are designed for two-step bioprinting. The white patterns represent the light reflecting patterns for photo-polymerization. (b) Images (5×) taken under fluorescent showing patterns of fluorescently labeled hiPSC-HPCs (green) in 5% (wt./vol) GelMA and supporting cells (red) in 2.5% (wt./vol) GelMA with 1% GMHA on day 0 (Scale bars, 500 μm).86 (iv) Biomimetic microfluidic device with liver microarchitecture. (a) Schematic of the biomimetic microfluidic device with a hexagonal cell culture chamber, (b) morphological images of a single hepatic sinusoid-like structure with HepG2 cells and human aortic endothelial cell line.89 Reprinted with permission from Ma et al., Anal. Chem. 88(3), 1719–1727 (2016). Copyright 2016 American Chemical Society. (v) (a) The microfluidic device prototype with four medium inlets/outlets (ABCD) and six cell culture wells. The width of the cell culture well ranges from 1 to 6 mm. (b) The top channel of the microfluidic device prototype was filled with the red dyes. (c) The zoom-in picture of the acinus-like culture well with the multi-row square-pillar PDMS microstructure with the trapped air. (d) The design sketch of the three rows microstructure.90 Reproduced with permission from Shin et al., Biomed. Microdevices 15(5), 767–780 (2013). Copyright 2013 Springer Nature. (vi) Measurement of oxygen saturation in the cell culture medium by fluorescence emitting sensor spots. Top: Integration of oxygen sensor spots in the microfluidic biochip. Sensor spots were integrated at the inlets (1, 3) and the outlets (2, 4) of the upper and lower channel systems, respectively. Establishment of a three-dimensional liver model in a microfluidic biochip. Middle: Cross section of the biochip-embedded liver model.91 Reproduced with permission from Rennert et al., Biomaterials 71, 119–131 (2015). Copyright 2015 Elsevier Ltd. All rights reserved. (vii) (a) The photograph of the fabricated microchip. (b) Scanning electron microscope (SEM) images of the concave microwell. (c) The scheme of cell aggregation and spheroid formation in the microwell. C1–C6, cell clture chamber 1–cell culture chamber 6.92 Reproduced with permission from Chen et al., Analyst 144(14), 4233–4240 (2019). Copyright 2019 the Royal Society of Chemistry.


