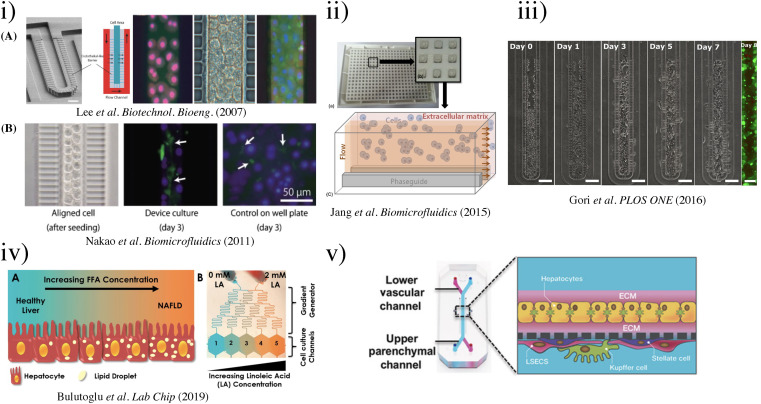
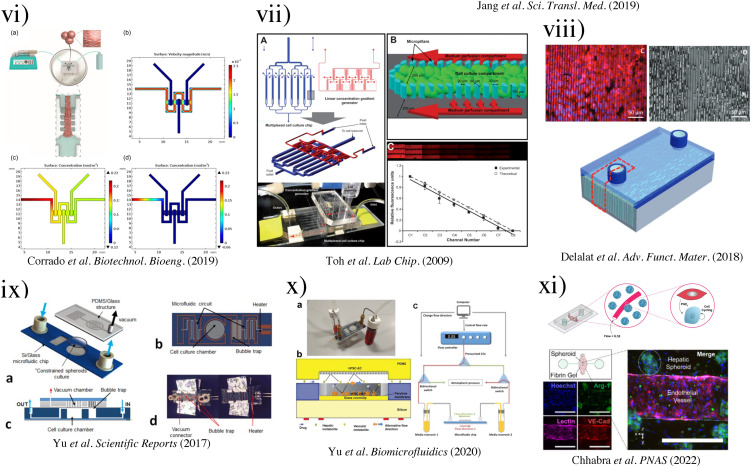
FIG. 6.
(i) (a) SEM image depicting the microfluidic sinusoid unit. Scale bar represents 50 μm. Microfluidic culture of hepatocytes.52 (Copyright 2007 Wiley Periodicals, Inc.); (b) results of cell alignment and culture. Left, aligned cells in two lines similar to a hepatic cord. Bile canaliculi were formed randomly in the well plate.69 Reproduced with permission from Nakao et al., Biomicrofluidics 5(2), 022212 (2011). Copyright 2011 AIP Publishing LLC. (ii) Schematic presentation of the microfluidic device. (a) The microfluidic structure is embedded on the bottom of 364-well plates. (b) Each culture chamber has three lanes with an inlet and an outlet, respectively. (c) Culture model for HepG2 cells in an extracellular matrix separated from flow without any physical barrier using phaseguides. HepG2 cells have indirect contact to flow. Reproduced with permission from Jang et al., Biomicrofluidics 9(3), 034113 (2015). Copyright 2015 AIP Publishing LLC. (iii) Phase contrast micrographs of HepG2 cell growth inside the microfluidic sinusoid over a week in culture (Day 0, 1, 3, 5, and 7 are shown). Scalebar: 100 μm. On the right, fluorescence micrograph of live/dead assay performed at Day 8 (living cells in green, calcein dye; dead cells in red, EthD-1 dye; scalebar: 50 μm).99 Reproduced with permission from Gori et al., PLOS ONE 11(7), e0159729 (2016). Copyright 2016 PLOS ONE. (iv) Schematics of the NAFLD development process and gradient microfluidics with the corresponding concentrations.95 Reproduced with permission from Bulutoglu et al., Lab Chip 19(18), 3022–3031 (2019). Copyright 2019 the Royal Society of Chemistry. (v) Schematic of the liver-chip that recapitulates complex liver cytoarchitecture. Primary hepatocytes are grown in the upper parenchymal channel in ECM sandwich format, and non-parenchymal cells are grown on the opposite side of the same membrane in the lower vascular channel.101 Reproduced with permission from Jang et al., Sci. Transl. Med. 11(517), eaax5516 (2019). Copyright 2019 The American Association for the Advancement of Science. (vi) Representation of the HepG2-μTPs loading procedure and fluid dynamic simulation.96 (Copyright 2018 Wiley Periodicals, Inc.). (vii) 3D HepaTox Chip for the simultaneous administration of multiple drug concentrations. (a) Microfluidic design and assembly of the linear concentration gradient generator and multiplexed cell culture chip. (b) Magnified view of a single cell culture channel of the multiplexed cell culture chip. An array of 30 × 50 mm micropillars separated the channel into three compartments. (c) Characterization of the concentration gradient profile in the 3D HepaTox Chip coupled with a linear concentration gradient generator.187 Reproduced with permission from Toh et al., Lab Chip 9(14), 2026–2035 (2009). Copyright 2009 the Royal Society of Chemistry. (viii) Functional maintenance of rat hepatocytes cell line (H-4-II-E) at a density of 1 × 10⁵ cells ml−1 on silicon microtrenches (11 mm in length × 10 mm in width) with different depths of 10 and 20 μm, with and without heparin coating, under static conditions. Representative bioartificial liver (bottom)97 (Copyright 2018 WILEY-VCH Verlag GmbH & Co. KGaA, Weinheim). (ix) Schematic of the perfusion-incubator-liver-chip (PIC). (a) 3D view with the PIC. (b) Bottom view of the chip's layout illustrating the microfluidic circuit, the cell culture chamber, the bubble trap, and the heater. (c) Cross section of the PIC illustrating the structure of the bubble trap. It consists of a 70 μm-thick PDMS membrane (gas permeable) bonded to a PDMS molded chamber with pillars that support the membrane. (d) Top and bottom views of the PIC.110 Reproduced with permission from Yu et al., Sci. Rep. 7(1), 14528 (2017). Copyright 2017 Scientific Reports. (x) Vascular-liver PIC: (a) photo of the PIC, showing the glass–silicon chip, connectors, tubing, and media reservoirs and (b) cross-section schematic of the cell co-culture chamber. (c) Schematic of the bidirectional perfusion culture testing setup.109 Reproduced with permission from Yu et al., Biomicrofluidics 14(3), 034108 (2020).Copyright 2020 AIP Publishing LLC. (xi) Model of molecular interactions in SHEAR. Cytokine stimulation combined with flow and IL-1β stimulates endothelial cells to produce PGE2, which plays an important role in the signaling cascade that leads to primary human hepatocyte cell-cycle entry in SHEAR devices.57 Reproduced with permission from Chhabra et al., Proc. Natl. Acad. Sci. U.S.A. 119(28), e2115867119 (2022). Copyright 2022 PNAS.


