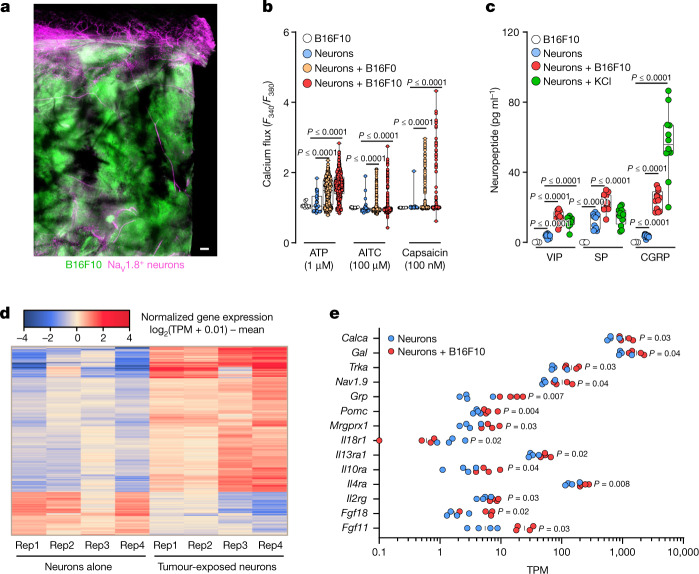
Fig. 1. Melanoma cells sensitize nociceptors.
a, Nociceptor (Nav1.8cre::tdTomatofl/WT; magenta) reporter mice were inoculated in the hindpaw with B16F10-eGFP cancer cells (i.d., 2 × 10⁵ cells; green). Representative image of NaV1.8+ nerve fibres (magenta) innervating B16F10-eGFP-inoculated mouse skin after 22 days. Scale bar, 200 μm. b, In co-culture, B16F0 or B16F10 cells sensitize the response of nociceptors to capsaicin (100 nM), allyl isothiocyanate (AITC, 100 μM) and ATP (1 μM), as measured by calcium flux. A low concentration of the ligands induces a minimal response in control neurons, whereas B16F10 cells show marginal sensitivity to ATP. c, Dorsal root ganglion (DRG) neurons co-cultured (96 h) with B16F10 cells release substance P (SP), vasoactive intestinal peptide (VIP) and CGRP. B16F10 cells alone do not release neuropeptides. Stimulation with KCl (40 mM; 30 min) induced a significant release of neuropeptides from cultured neurons. d,e, Naive DRG neurons (Trpv1cre::-CheRiff-eGFPfl/WT) were cultured alone or in combination with B16F10-mCherry-OVA cells. After 48 h, the cells were collected, FACS purified and RNA sequenced. Hierarchical clustering of DEGs from the sorted neurons shows distinct groups of transcripts enriched in cancer-exposed TRPV1+ neurons (d), including Calca (the gene encoding CGRP; e). Data are shown as a representative image (a), as box-and-whisker plots (running from minimal to maximal values; the box extends from 25th to 75th percentile and the middle line indicates the median), for which individual data points are given (b,c), as a heat map showing normalized gene expression (log2(0.01 + transcripts per million reads (TPM)) − mean (d) or as a scatter dot plot with medians (e). Experiments were independently repeated two (a) or three (b,c) times with similar results. The sequencing experiment was not repeated (d,e). n as follows: a: n = 4; b: neurons (29 neurons from 10 mice), B16F10 (16 cells from 10 dishes), neurons + B16F0 (387 neurons from 12 mice), neurons + B16F10 (409 neurons from 12 mice); c: neurons (n = 12), neurons + B16F10 (n = 12), neurons + KCl (n = 12), B16F10 (n = 3); d,e: n = 4 per group. P values were determined by one-way ANOVA with post-hoc Bonferroni (b,c) or two-sided unpaired Student’s t-test (e).

