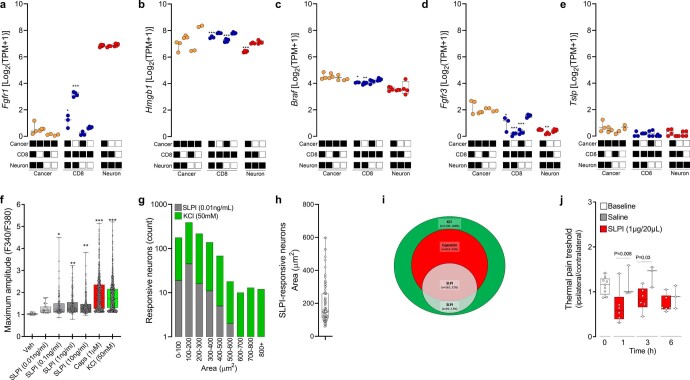
Extended Data Fig. 5. B16F10-secreted SLPI activates nociceptor neurons.
(a–e) Naive DRG neurons (Trpv1cre::CheRiff-eGFPfl/WT), B16F10-mCherry-OVA, and OVA-specific cytotoxic CD8+ T cells were cultured alone or in combination. After 48h, the cells were collected, FACS purified, and RNA sequenced. DEGs were calculated, and Fgfr1 (fibroblast growth factor receptor 1) was found to be overexpressed in OVA-specific cytotoxic CD8+ T cells when co-cultured with cancer cells and DRG neurons (a). Conversely, OVA-specific cytotoxic CD8+ T cells downregulates the expression of the pro-nociceptive factor Hmgb1 (High–mobility group box 1; b), Braf (c), as well as Fgfr3 (d) when co-cultured with B16F10-mCherry-OVA and DRG neurons. Tslp expression level was not affected in any of tested groups (e). (f–i) Using calcium microscopy, we probed whether SLPI directly activates cultured DRG neurons. We found that SLPI (0.01-10 ng/mL) induces a significant calcium influx in DRG neurons (f). SLPI-responsive neurons are mostly small-sized neurons (g-h; mean area = 151 μm2) and largely capsaicin-responsive (i; ~42%). (j) The right hindpaw of naive mice was injected with saline (20 μL) or SLPI (i.d., 1 μg/20 μL), and the mice’s noxious thermal nociceptive threshold was measured (0-6h). The ipsilateral paw injected with SLPI showed thermal hypersensitivity in contrast with the contralateral paw. Saline had no effect on the mice’s thermal sensitivity. Data are shown as box-and-whisker plots (runs from minimal to maximal values; the box extends from 25th to 75th percentile and the middle line indicates the median), for which individual data points are given (a–f, h, j), stacked bar graph on a logarithmic scale (g), and Venn Diagram (i). N are as follows: a–e: n = 2–4/groups, f: vehicle (n = 28), 10pg/ml (n = 28), 100 pg/ml (n = 132), 1,000 pg/ml (n = 191), 10 ng/ml (n = 260), capsaicin (n = 613), KCl (n = 1,139), g: 0-100 (SLPI=19; KCl=177), 100-200 (SLPI = 45; KCl = 390), 200-300 (SLPI = 16; KCl =216), 300-400 (SLPI=11; KCl = 138), 400-500 (SLPI = 5; KCl = 68), 500-600 (SLPI=2, KCl = 18), 600-700 (SLPI = 0; KCl = 10), 700-800 (SLPI=0; KCl=13), 800+ (SLPI = 0; KCl = 12), h: n = 98, i: KCl+=1139, KCl+Caps+=614, KCl+Caps+SLPI+=261, KCl+Caps-SLPI+=29, j: 0h (n = 9), SLPI at 1h (n = 6), saline at 1h (n = 3), SLPI at 3h (n = 6), saline at 3h (n=3), SLPI at 6h (n = 6), saline at 6h (n = 3). Experiments were independently repeated two (j) or three (f–i) times with similar results. Sequencing experiment was not repeated (a–e). P-values were determined by one-way ANOVA post-hoc Bonferroni (a–f); or two-sided unpaired Student’s t-test (j). P-values are shown in the figure or indicated by * for p ≤ 0.05; ** for p ≤ 0.01; *** for p ≤ 0.001.

