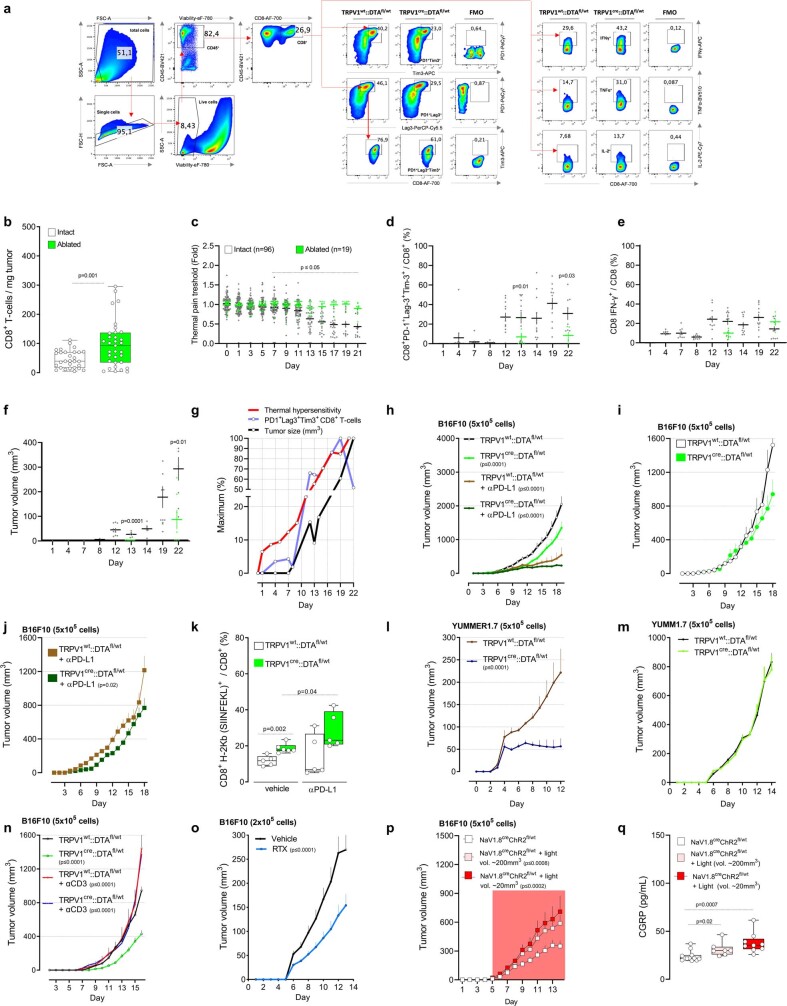
Extended Data Fig. 6. Nociceptor ablation reduces the exhaustion of intratumoral CD8+ T cells.
(a-b) Orthotopic B16F10-mCherry-OVA (5x10⁵ cells; i.d.) cells were injected to nociceptor intact (Trpv1WT::DTAfl/WT) and ablated (Trpv1cre::DTAfl/WT) mice. Sixteen days post-B16F10-mCherry-OVA cells inoculation (5x10⁵ cells; i.d.), tumour-infiltrating CD8+ T cells were immunophenotyped (a) and were found to be more numerous in sensory neuron depleted tumours (b). (c-g) Orthotopic B16F10-mCherry-OVA (2x10⁵ cells; i.d.) cells were injected into the left hindpaw paw of nociceptor intact (n = 96; Trpv1WT::DTAfl/WT) or ablated (n = 18; Trpv1cre::DTAfl/WT) mice. When compared to their baseline threshold, littermate control mice showed significant thermal hypersensitivity on day 7, an effect that peaks on day 21 (c). In these mice, intratumoral frequency of PD-1+LAG3+TIM3+ (d) and IFNγ+ (e) CD8+ T cells increased 12 days post tumour inoculation, an effect that peaked on day 19. Finally, B16F10 tumour volume peaked on day 22 (f). When compared with littermate control mice, sensory neuron ablated mice inoculated with B16F10 cells showed no thermal pain hypersensitivity (c), reduced intratumoral frequency of PD-1+LAG3+TIM3+ CD8+ T cells (d) and tumour volume (f). In littermate control mice, thermal pain hypersensitivity (day 7) precedes the increase in intratumoral frequency of PD-1+LAG3+TIM3+ CD8+ T cells (day 12), and significant tumour growth (day 12; g). (h) Orthotopic B16F10-mCherry-OVA cells (5x10⁵ cells; i.d.) were inoculated into 8-week-old male and female sensory neuron intact or ablated mice. The mice were treated with αPD-L1 (6 mg/kg, i.p.; days 7, 10, 13, 16 post tumour inoculation) or its isotype control. On day 19, αPD-L1 potentiated the nociceptor ablation mediated reduction in B16F10-OVA tumour volume. (i–k) Orthotropic B16F10-mCherry-OVA cells (5x10⁵ cells, i.d.) were injected into a cohort of nociceptor neuron-ablated mice 3 days prior to the injection given to nociceptor intact mice. Mice from each group with similar tumour size (~85mm3) were selected and exposed to αPD-L1 (6 mg/kg, i.p.) once every 3 days for a total of 9 days. Eighteen days post tumour inoculation, we found that αPD-L1-reduced tumour growth was higher (~47%) in nociceptor-ablated mice than was observed in nociceptor-intact mice (~32%; i–j). In addition, nociceptor ablation increased the proportion of intratumoral tumour-specific (k; defined as H-2Kb+) CD8+ T cells. These differences were further enhanced by αPD-L1 treatment (i–k). (l–m) Sensory neurons ablation (Trpv1cre::DTAfl/WT) decreased growth of YUMMER1.7 cells (5×10⁵ cells; i.d.) an immunogenic version of a BrafV600ECdkn2a−/−Pten−/− melanoma cell line (l; assessed until day 12). The non-immunogenic YUMM1.7 cell line (5×10⁵ cells; i.d.; assessed until day 14) cells were injected to nociceptor intact (Trpv1WT::DTAfl/WT) and ablated mice (Trpv1cre::DTAfl/WT). Nociceptor ablation had no effect on YUMM1.7 growth (m). (n) Orthotopic B16F10-mCherry-OVA (5x10⁵ cells; i.d.) cells were injected to nociceptor intact (Trpv1WT::DTAfl/WT) and ablated mice (Trpv1cre::DTAfl/WT). The reduction in B16F10-mCherry-OVA (5×10⁵ cells; i.d.) tumour growth observed in nociceptors ablated mice was absent following systemic CD3 depletion (assessed until day 15; αCD3, 200 μg/mouse; i.p.; every 3 days). (o) To deplete their nociceptor neurons, C57BL6J mice were injected with RTX (s.c., 30, 70, 100 μg/kg) and were subsequently (28 days later) inoculated with B16F10-mCherry-OVA (2×10⁵ cells). RTX-injected mice showed reduced tumour growth when compared to vehicle-exposed mice (assessed until day 13). (p–q) Orthotopic B16F10-mCherry-OVA (5×10⁵ cells; i.d.) cells were injected to light-sensitive mice (Nav1.8cre::ChR2fl/WT). As opposed to unstimulated mice, the optogenetic activation (3.5 ms, 10Hz, 478nm, 60 mW, giving approx. 2-6 mW/mm2 with a 0.39-NA fibre placed 5–10 mm from the skin, 20 min) of tumour-innervating nociceptor neurons, when started once B16F10 tumours were visible (~20 mm3) or well established (~200 mm3), resulted in enhanced tumour growth (p, as measured until day 14) and intratumoral CGRP release (q). Data are shown as FACS plot (a; depict the gating strategy used in fig. 3d,e), as box-and-whisker plots (runs from minimal to maximal values; the box extends from 25th to 75th percentile and the middle line indicates the median) for which individual data points are given (b,k,q), scatter dot plot (c–f), percentage change from maximal thermal hypersensitivity, intratumoral frequency of PD-1+LAG3+TIM3+ CD8+ T cells and tumour volume (g), or mean ± S.E.M (h–j, l–p). N are as follows: a–b: intact (n = 29), ablated (n = 33), c: intact (n = 96), ablated (n = 19), d: intact (n = 92), ablated (n = 15), e: intact (n = 96), ablated (n = 15), f: intact (n = 96), ablated (n = 16), g: n=96, h: intact (n = 9), ablated (n = 10), intact+αPD-L1 (n = 9), ablated+αPD-L1 (n = 8), i: intact (n = 14), ablated (n = 4), j: intact+αPD-L1 (n = 12), ablated+αPD-L1 (n = 12), k: intact (n = 5), ablated (n = 6), intact+αPD-L1 (n = 5), ablated+αPD-L1 (n = 5), l: intact (n = 8), ablated (n = 11), m: intact (n = 6), ablated (n = 13), n: intact (n = 5), ablated (n = 5), intact+αCD3 (n = 6), ablated+αCD3 (n = 5), o: vehicle (n = 11), RTX (n = 10), p: Nav1.8cre::ChR2fl/WT (n = 12), Nav1.8cre::ChR2fl/WT + Light (vol. ~200 mm3) (n = 8), Nav1.8cre::ChR2fl/WT + Light (vol. ~20 mm3) (n = 8), q: Nav1.8cre::ChR2fl/WT (n = 12), Nav1.8cre::ChR2fl/WT + Light (vol. ~200 mm3) (n = 7), Nav1.8cre::ChR2fl/WT + Light (vol. ~20 mm3) (n = 9). Experiments were independently repeated two (c–g), three (h–q) or six (a,b) times with similar results. P-values are shown in the figure and determined by two-sided unpaired Student’s t-test (b–f, k,q), or two-way ANOVA post-hoc Bonferroni (h–j, l–p).

