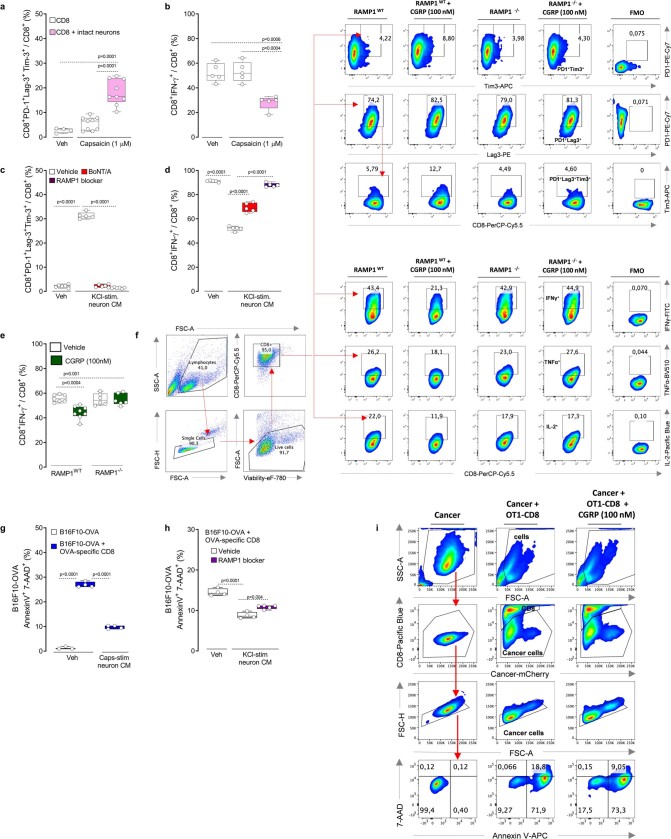
Extended Data Fig. 9. Nociceptor-released CGRP increases cytotoxic CD8+ T cell exhaustion.
(a–b) Splenocytes-isolated CD8+ T cells were cultured under Tc1-stimulating condition (ex vivo activated by CD3 and CD28, IL-12, and anti-IL4) for 48h. The cells were then cultured or not with wild-type DRG neurons and exposed to capsaicin (1 μM, challenged once every two days) or its vehicle. As measured after 4 days stimulation, capsaicin-stimulated intact neuron increased the proportion of PD-1+LAG3+TIM3+ (a) cytotoxic CD8+ T cells, while it decreased the one of IFNγ+ (b). (c–d) Splenocytes-isolated CD8+ T cells were cultured under Tc1-stimulating conditions (ex vivo activated by CD3 and CD28, IL-12, and anti-IL4) for 48h. In the presence of peptidase inhibitors (1 μL/mL), naive DRG neurons were cultured in the presence of BoNT/A (50 pg/mL) or its vehicle for 24h. The cells were then washed, stimulated (30 min) with KCl (50mM), and the conditioned medium collected. On alternate days for 4 days, the cytotoxic CD8+ T cells were exposed or not to a RAMP1 blocker (CGRP8–37; 2 μg/mL) and challenge (1:2 dilution) with fresh KCl-induced conditioned medium from naive, or BoNT/A-silenced neurons. As measured after 4 days stimulation, KCl-stimulated neuron-conditioned medium increased the proportion of PD-1+LAG3+TIM3+ (c) cytotoxic CD8+ T cells, while it decreased the one of IFNγ+ (d). Such effect was absent when cytotoxic CD8+ T cells were co-exposed to the RAMP1 blocker CGRP8–37 or challenged with the neuron conditioned medium collected from BoNT/A-silenced neurons (c–d). (e–f) Splenocytes-isolated CD8+ T cells from wild-type and Ramp1−/− mice were cultured under Tc1-stimulating conditions (ex vivo activated by CD3 and CD28, IL-12, and anti-IL4) for 48h. On alternate days for 4 days, the cytotoxic CD8+ T cells were exposed to CGRP (0.1 μM) or its vehicle. As measured after 4 days stimulation, representative flow cytometry plots (f) show that CGRP decrease RampWT cytotoxic CD8+ T cells expression of IFNγ+ (e,f), TNF+ (f), and IL-2+ (f) when exposed to CGRP. Inversely, CGRP increase the proportion of PD-1+LAG3+TIM3+ in Ramp1WT cytotoxic CD8+ T cells (f). Ramp1−/− cytotoxic CD8+ T cells were protected from the effect of CGRP (e–f). (g–i) Splenocytes-isolated CD8+ T cells from naive OT-I mice were cultured under Tc1-stimulating conditions (ex vivo activated by CD3 and CD28, IL-12, and anti-IL4) for 48h. B16F10-mCherry-OVA cells (1×10⁵ cells) were then cultured with or without OT-I cytotoxic CD8+ T cells (4×10⁵ cells). Tc1-stimulated OT-I-CD8+ T cells lead to B16F10-OVA cell apoptosis (AnnexinV+7AAD+; g, measured after 48h; h–i, measured after 24h). B16F10-mCherry-OVA cells elimination by cytotoxic CD8+ T cells was reduced when the co-cultures were challenged (1:2 dilution; once daily for two consecutive days) with fresh conditioned medium collected from capsaicin (1 μM)-stimulated naive DRG neurons (g; measured after 48h). Similarly, KCl (50mM)-stimulated naive DRG neurons conditioned medium (1:2 dilution) reduced B16F10-mCherry-OVA apoptosis (h; measured after 24h). This effect was blunted when the cells were co-exposed to the RAMP1 blocker CGRP8-37 (h; 2 μg/mL; measured after 24h). CGRP (0.1 μM) challenges also reduced OT-I cytotoxic CD8+ T cells elimination of B16F10-OVA cell (i; measured after 24h). Data are shown as box-and-whisker plots (runs from minimal to maximal values; the box extends from 25th to 75th percentile and the middle line indicates the median), for which individual data points are given (a–e, g–h), or representative FACS plot (f, i). N are as follows: a: CD8 + vehicle (n = 4), CD8 + capsaicin (n = 9), CD8 + neuron + capsaicin (n = 9), b: n = 5/groups, c: CD8 (n = 6), CD8 + KCl-induced neurons CM (n = 5), CD8 + KCl-induced neurons CM + CGRP8-37 (n = 6), CD8 + KCl-induced neurons CM + BoNT/A (n = 6), d: n = 5/groups, e: Ramp1WT CD8 + vehicle (n = 7), Ramp1WT CD8 + CGRP (n = 8), Ramp1−/− CD8 + vehicle (n = 6), Ramp1−/− CD8 + CGRP (n = 6), g: B16F10 (n = 3), B16F10 + OT-I CD8 (n = 4), B16F10 + OT-I CD8 + KCl-induced neuron CM (n = 4), h: B16F10 + OT-I CD8 (n = 4), B16F10 + OT-I CD8 + KCl-induced neuron CM (n = 4), B16F10 + OT-I CD8 + KCl-induced neuron CM + CGRP8–37 (n = 5). Experiments were repeated a minimum of three independent times with similar results. P-values are shown in the figure and determined by one-way ANOVA posthoc Bonferroni (a–e, g–h).

