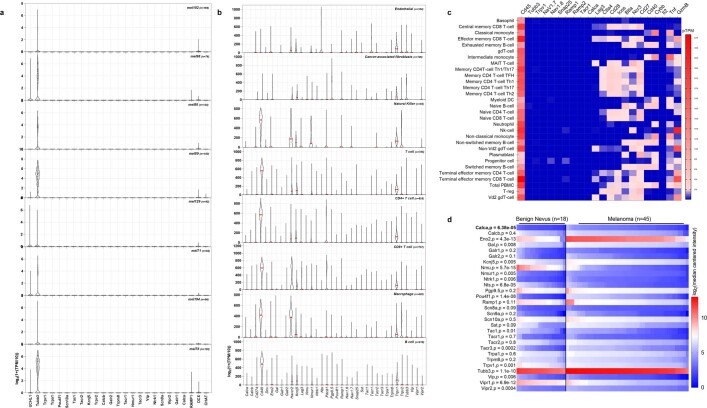
Extended Data Fig. 1. TRPV1, NAV1.8, SNAP25 or RAMP1 transcripts are expressed in patient melanoma biopsies but are not detected in human immune cells or malignant cells.
(a–b) In silico analysis of single-cell RNA sequencing of human melanoma-infiltrating cells revealed that Trpv1, Nav1.8 (Scn10a), Snap25 (the molecular target of BoNT/A), Calca (gene encoding for CGRP) transcripts are not detected in malignant melanoma cells (defined as CD90–CD45–) from ten different patients’ biopsies (a) nor in cancer-associated fibroblasts, macrophage, endothelial, natural killer, T, and B cells (b). Individual cell data are shown as a log2 of 1 + (transcript per million / 10). Experimental details and cell clustering were defined in Jerby-Arnon et al41. N are defined in the figures. (c) In silico analysis of human immune cells revealed their basal expression of Cd45. Using RNA sequencing approaches, Calca, Snap25, Trpv1 or NaV1.8 are not detected in these cells. Heat maps show the read counts normalized to transcripts per million protein-coding genes (pTPM) for each of the single-cell clusters. Experimental details and cell clustering were defined in Monaco et al73. (d) Forty-five cutaneous melanomas and 18 benign melanocytic skin nevus biopsies transcriptomes were profiled using Affymetrix U133A microarrays19. In silico analysis of this dataset revealed that cutaneous melanoma heightened expression levels of Calca (1.4-fold), Pouf4f1 (2-fold), Eno2 (1.4-fold), and Tubb3 (1.1-fold), as well as other neuronal-enriched genes. Heat map data are shown as log2 (median centred intensity); two-sided unpaired Student’s t-test; p-values and n are shown in the figure. Experimental details were defined in Haqq et al19.

