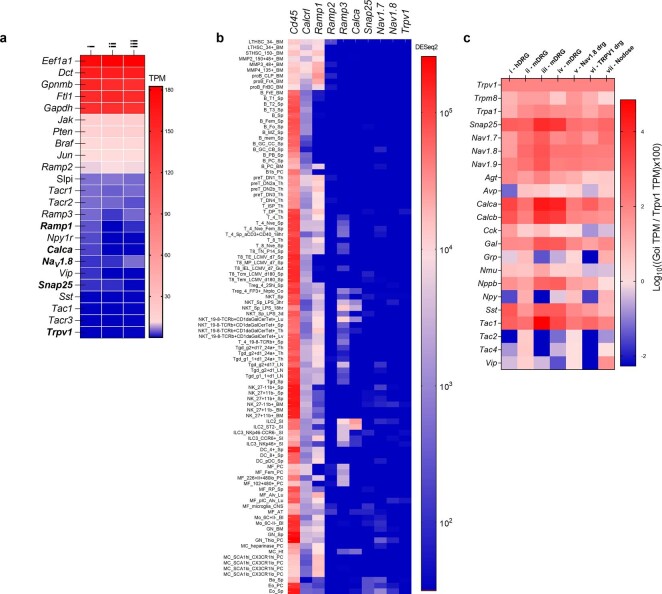
Extended Data Fig. 3. Trpv1, Nav1.8, Snap25 or Ramp1 transcripts are not detected in B16F10 cancer cells or mouse immune cells.
(a) In silico analysis of three different B16F10 cells cultures (labelled as i, ii, iii)74 revealed their basal expression of Braf and Pten. In contrast, Calca, Snap25, Trpv1 or NaV1.8 transcripts are not detected in B16F10 cells. Heat map data are shown as transcript per million (TPM) on a linear scale. Experimental details were defined in Castle et al74. N=3/group. (b) ImmGen RNA sequencing of leukocyte subpopulations76 reveals their basal expression of Cd45 and Ramp1. In contrast, Snap25, Trpv1, or Nav1.8 transcripts are not detected in mouse immune cells. Heat map data are shown as DESeq2 on a logarithmic scale. (c) A meta-analysis of seven published nociceptor neuron expression profiling datasets66 revealed the basal expression of sensory neuron markers (Trpv1, Trpa1) and neuropeptides (Sp, Vip, Nmu, Calca). Expression across datasets was ratioed over Trpv1 and multiplied by 100. The log10 of these values is presented as a heat map. i) RNA sequencing of human lumbar neurons;72 ii) microarrays of mouse FACS-sorted NaV1.8+ neurons;70 iii) and iv) single-cell RNA sequencing of mouse lumbar neurons;68,69 v) microarray profiling of mouse NaV1.8+ DRG neurons;70 vi) performed RNA sequencing of mouse TRPV1+ neurons;71 and vii) single-cell RNA sequencing of mouse vagal ganglia67.

