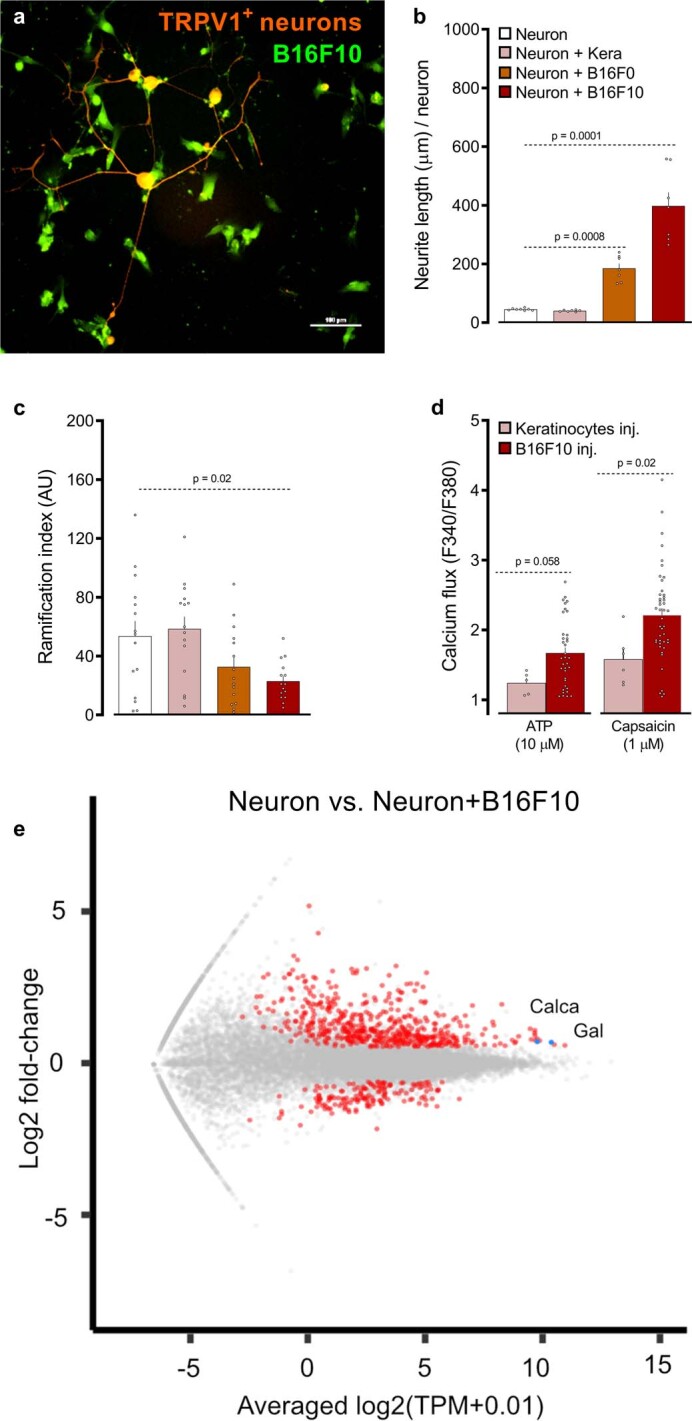
Extended Data Fig. 4. B16F10 cells interact with nociceptor neurons.

(a–c) When co-cultured with B16F10-eGFP cells (green), TRPV1+ nociceptor (Trpv1cre::tdTomatofl/WT; orange) neurons form neuro-neoplasic contacts (a), show longer neurites (b), and exhibit reduced arborization (c) than when cultured alone or with non-tumorigenic keratinocytes (b–c). (d) L3–L5 DRG neurons were collected from mice 2-weeks after they were inoculated (left hindpaw; i.d.) with B16F10- or non-tumorigenic keratinocytes, cultured and calcium flux to ligands tested (ATP (10 μM), and capsaicin (1 μM)). Compared to neurons from keratinocytes-injected mice, the one from tumour-bearing mice showed increased sensitivity to capsaicin. (e) Naive DRG neurons (Trpv1cre::CheRiff-eGFPfl/WT) were cultured alone or in combination with B16F10-mCherry-OVA. After 48h, the cells were collected, FACS purified, and RNA sequenced. Hierarchical clustering of sorted neuron DEG show distinct groups of transcripts enriched in TRPV1+ neuron vs cancer-exposed TRPV1+ neuron populations. Pairwise comparison of naive TRPV1+ neuron vs cancer-exposed TRPV1+ neuron populations showing differentially expressed transcripts as a volcano plot (p<0.05). Among others, Calca (gene encoding for CGRP) was overexpressed in TRPV1+ (FACS-purified eGFP-expressing cells) neurons when co-cultured with B16F10-mCherry-OVA. Data are shown as representative image (a), mean ± S.E.M (b–d), or volcano plot (e). N are as follows: a: n = 4, b: neuron (n=8), neuron + keratinocytes (n = 7), neuron + B16F0 (n = 7), neuron + B16F10 (n = 7), c: n = 15/groups, d: keratinocytes inj. + ATP (n=5), B16F10 inj. + ATP (n=36), Keratinocytes inj. + caps (n = 6), B16F10 inj. + caps (n = 44), e: n = 4/groups. Experiments were independently repeated two (d) or three (a–c) times with similar results. Sequencing experiment was not repeated (e). P-values are shown in the figure and determined by one-way ANOVA post-hoc Bonferroni (b–c) or two-sided unpaired Student’s t-test (d). Scale bar = 100 μm (a).
