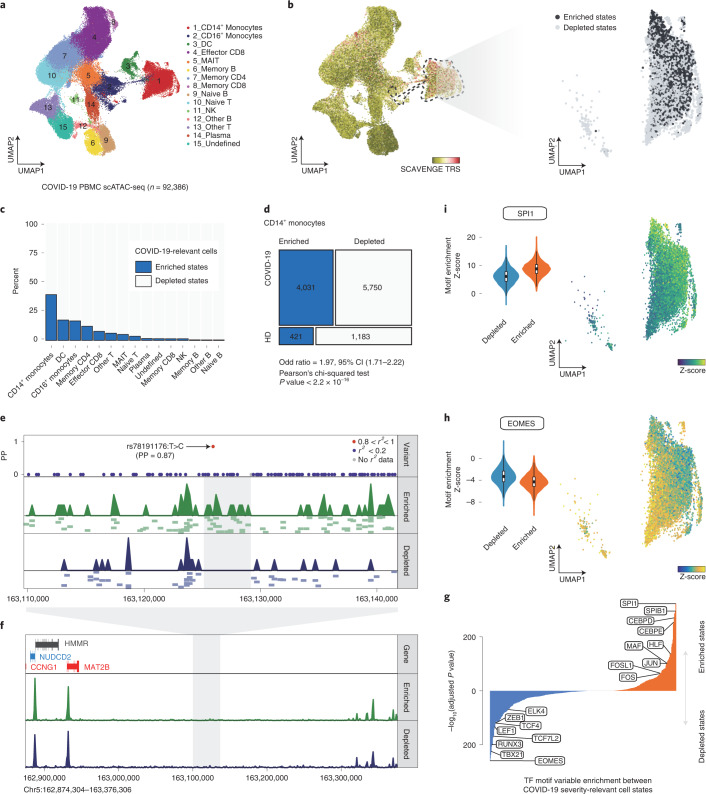
Fig. 4. SCAVENGE captures disease-associated cell states and dissects the heterogeneity in association of COVID-19 severity in CD14+ monocytes.
a, A UMAP plot of scATAC-seq profiles of 92,386 PBMCs from healthy and COVID-19 donors31. Cells are colored by the cell type annotation. b, SCAVENGE TRS for the trait of COVID-19 severity risk is displayed for all cells in the UMAP plot (left). CD14+ monocytes are highlighted with dashed lines, and two cell states related to COVID-19 risk variant are identified (Methods) and shown with UMAP coordinates (right). c, The percent of cells that are enriched and depleted for COVID-19 severity risk variant are shown across all the cell types. d, A mosaic plot depicts the distribution of trait-relevant cell states corresponding to disease status. The significance of association is calculated using Pearsonʼs chi-squared test. e,f, The COVID-19 severity variant rs78191176 with high causal probability (PP = 0.87) enriched regulatory signals exclusively in trait-relevant cell states (e), despite, overall, a high similarity being observed between pseudo-bulk tracks of these two cell states (f). The LocusZoom-style plot of fine-mapped variants is shown, and the color represents the degree of linkage (r2). The pseudo-bulk track is aggregated from single-cell accessibility profiles within the same cell state. Further normalization and adjustment are performed to ensure that pseudo-bulk tracks can be compared directly. A number of representative single-cell-based accessibility profiles are shown below the pseudo-bulk tracks in e. Each pixel represents a 500-bp region. g, Differential comparison of chromVAR TF motif enrichment between COVID-19 risk variant-enriched and variant-depleted CD14+ monocytes. Bonferroni-adjusted significance level is indicated. h,i, The chromVAR enrichment Z-scores for EOMES (h) and SPI1 (i) motifs are shown in UMAP plots (right) and violin plots (left) across CD14+ monocytes as shown in b. The center, bounds and whiskers of the box plot (n = 4,452 for enriched state and n = 6,933 for depleted state) show median, quartiles and data points that lie within 1.5× interquartile range of the lower and upper quartiles, respectively. CI, confidence interval; DC, dendritic cell; MAIT, mucosal-associated invariant T.

