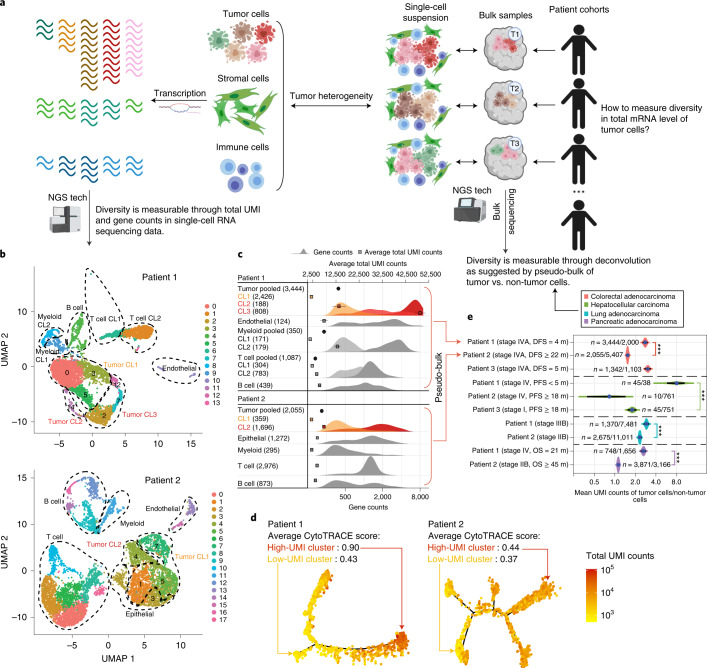
Fig. 1. High diversity of total mRNA expression in cancer cells.
a, Illustration of diversity in total mRNA levels in tumor cells versus other cell types. b, UMAP plots of scRNA-seq data from two patients with colorectal cancer. Tumor cell clusters are bolded in both samples. Dashed circles indicate groups of cells that are similar in total UMI and gene counts, which are merged for simplicity. c, Distributions of gene counts and total UMI counts by cell type in scRNA-seq data from the two patients shown in b. The top x axis annotates total UMI counts (with mean and 95% CI). The bottom x axis annotates gene count distribution (density). Density curves are colored for tumor cells and shown in grayscale for non-tumor cells. Clusters with higher gene counts are shown in darker shades. Numbers of cells analyzed are indicated in parentheses. Tumor cell clusters are highlighted by the same colors as those in b. d, Monocle-inferred trajectories for tumor cells from the two patients. Cells on the trees are colored by total UMI counts. Average differentiation scores by CytoTRACE for high-UMI and low-UMI clusters are provided. e, Ratios of mean total UMI counts of tumor cells to non-tumor cells (n = number of tumor cells / number of non-tumor cells) and 95% CIs in pooled scRNA-seq data (pseudo-bulk) from ten patients with colorectal (n = 3, including patients 1 and 2 shown in b–d), hepatocellular (n = 3), lung (n = 2) and pancreatic (n = 2) cancers. DFS, disease free survival; PFS, progression-free survival; OS, overall survival. The Benjamini–Hochberg-adjusted P values for two-sided Wilcoxon rank-sum tests comparing the ratios between patient samples are indicated by asterisks (*P < 0.05, **P < 0.01 and ***P < 0.001). UMAP, uniform manifold approximation and projection.

