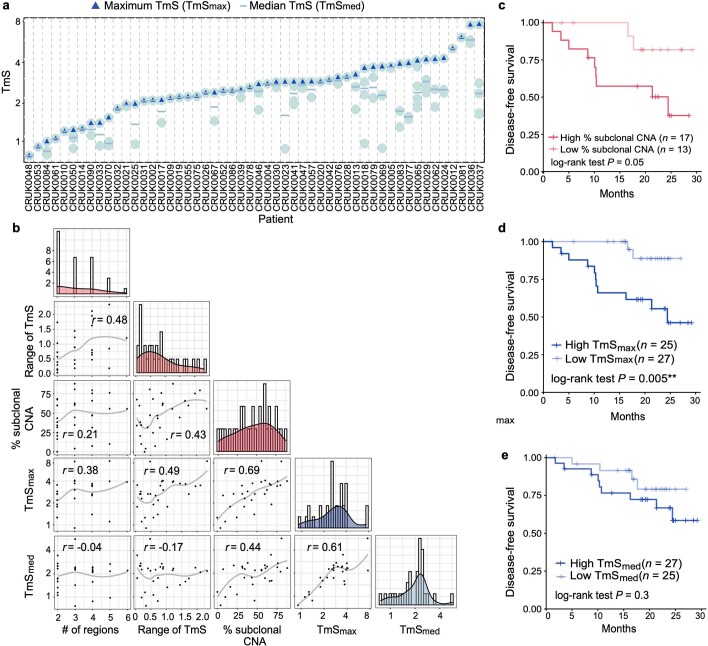
Extended Data Fig. 10. Regional TmS identifies spatial heterogeneity and refines prognostication in patients with early-stage lung cancer.
a, Distribution of TmS values for 116 tumor regions from 52 patients of the TRACERx study. Blue triangles denote the maximum TmS for a patient. Blue ‘-‘ denote the median TmS for a patient. b, Pairwise scatter plots and histograms of number of regions, range of TmS, % subclonal CNA, maximum of TmS across regions (TmSmax), and median of TmS across regions (TmSmed) per patient. The number of evaluated patients with at least 2 regions is 30. Spearman correlation coefficient r’s are shown, and the gray lines represent a loess fit. c, KM survival curves of DFS for the 30 patients stratified by % subclonal CNA: high versus low. d-e, KM survival curves of DFS for all 52 patients stratified into two groups by TmSmax (d) and (e) TmSmed, respectively. P values obtained by log-rank tests between high vs. low TmS groups are indicated by asterisks (* P < 0.05, ** < 0.01, *** < 0.001).

