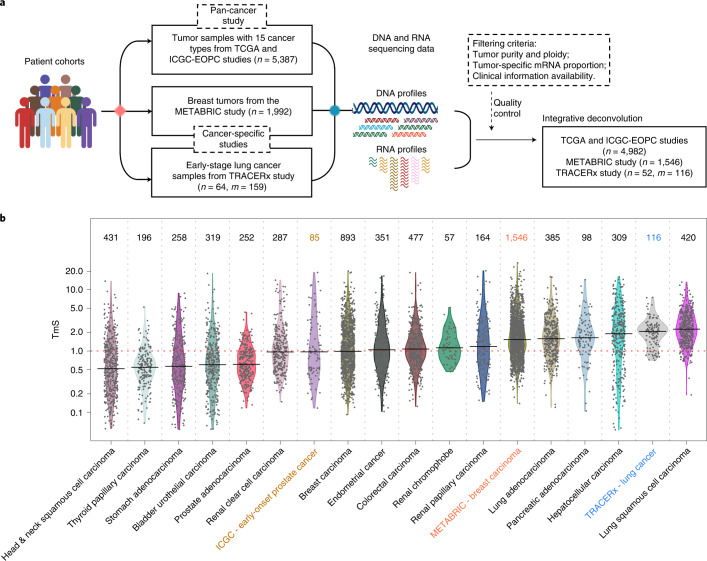
Fig. 3. Estimation of tumor-specific total mRNA expression in bulk sequencing data.
a, Diagram for the TmS calculation in TCGA, ICGC-EOPC, METABRIC and TRACERx datasets. The number of patients is denoted by n. When there are more than one tumor sample for each patient, the number of tumor samples is denoted by m. b, Distribution of TmS in 6,644 tumor samples from 6,580 patients across 15 cancer types in TCGA, ICGC-EOPC, METABRIC and TRACERx. The number of tumor samples for each cancer type is indicated above each violin plot.

