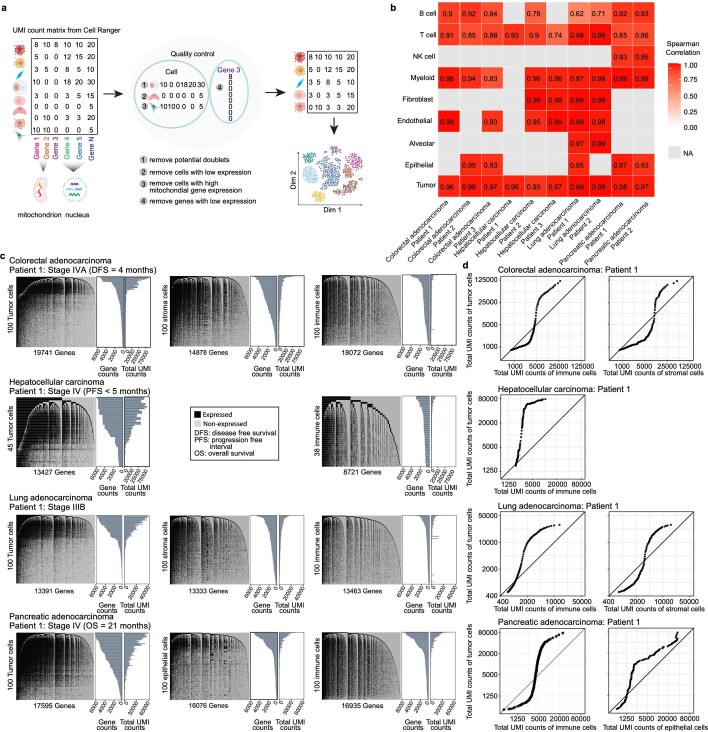
Extended Data Fig. 1. High diversity of total mRNA expression in tumor cells.
a, Flowchart of scRNA-seq data preprocessing. b, Heatmap showing the Spearman correlations between gene counts and total UMI counts across cell types in the ten patient samples. c, Illustration of expressed genes in tumor cells (left panels) compared to non-tumor cells: epithelial and stromal cells (middle panels) and immune cells (right panels). The data shown are based on cells randomly selected from each of the four ‘patient 1’ samples with colorectal, hepatocellular, lung and pancreatic cancers, who presented worse prognosis or advanced disease. In each heatmap, expressed genes (UMI count > 0) are shown in black, and non-expressed genes (UMI count = 0) are shown in gray. Cells in the rows and genes in the columns are ordered from high to low by the total numbers of expressed genes and the number of cells with detected expression of each gene, respectively. Barplots provide the corresponding distributions of gene counts and total UMI counts. d, Q-Q plots of total UMI counts in tumor cells compared to non-tumor cells for the same four ‘patient 1’ samples that were used as in c. For each patient, the log2 transformed total UMI counts of immune cells (left) or stromal/epithelial cells (right) are used as the theoretical quantiles, respectively.

