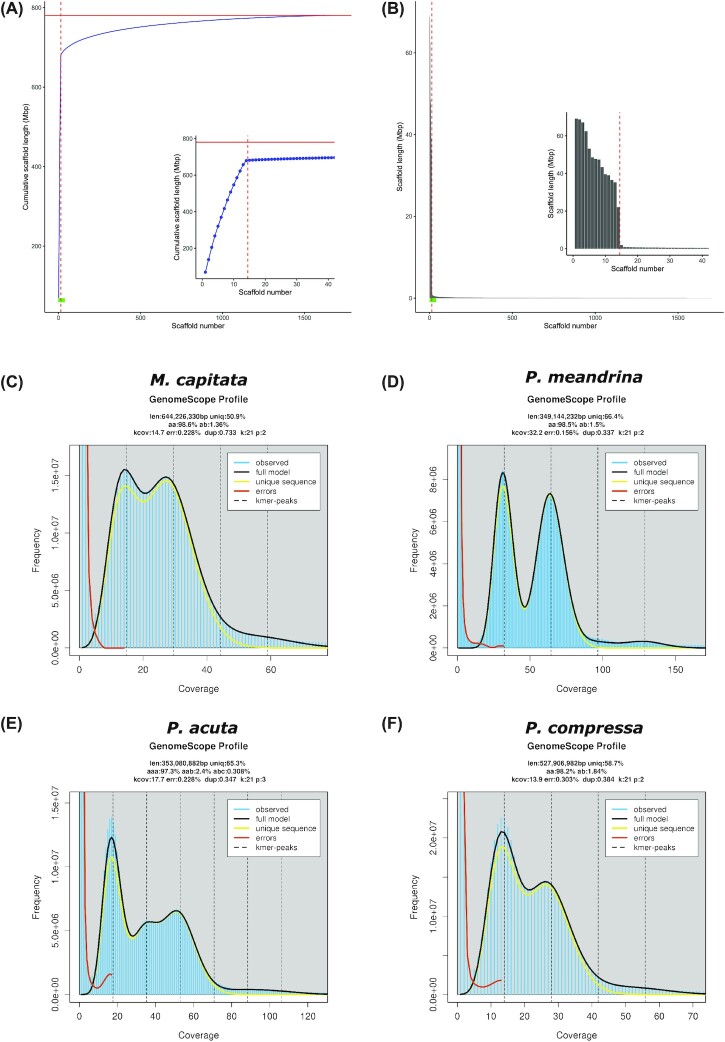
Figure 2:
(A) Cumulative and (B) individual length of scaffolds in the new Hawaiian M. capitata genome assembly. Scaffolds were sorted by length in descending order; each point along the x-axis of (A) and (B) represents a scaffold, with the longest scaffold being the first and the shortest being the last on the x-axis of each plot. In (A) and (B), a zoomed-in section of the larger plot (indicated by a green bar along the x-axis) is shown on the right highlighting the 40 largest scaffolds; a horizontal red line in (A) shows the total assembled bases in the new genome and a vertical dashed line in (A) and (B) is positioned after the 14th largest scaffold. GenomeScape2 linear k-mer distributions of the Hawaiian (C) M. capitata, (D) P. meandrina, (E) P. acuta, and (F) P. compressa species with theoretical diploid (or triploid for P. acuta) models shown by the black lines. The GenomeScope2 profiles were computed for each species using 21-mers generated from the trimmed short-read data listed in Supplementary Table S5.

