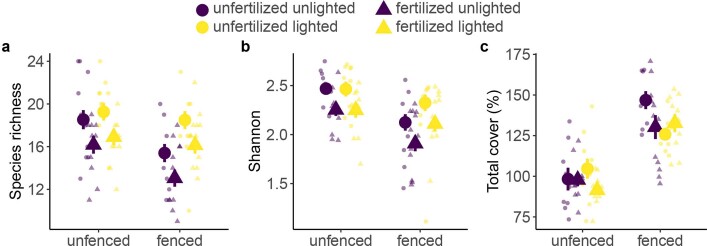
Extended Data Fig. 2. Effects of fencing, fertilization and light addition on species richness, Shannon diversity and total cover in 2019.
(Species richness (a), Shannon diversity (b), and total vegetation cover (%) (c). Values are means ± s.e.m. derived from LME models where parameter significance was assessed by F-tests (2-tailed); for statistics see Methods and Extended Data Tables 2 and 5. unfenced, unlighted and lighted n = 10; fenced, unlighted and lighted n = 8; fenced and fertilized, lighted and unlighted n = 12; fertilized, unlighted and lighted n = 10. Individual data points are shown with faded colour. Sampling unit is a quadrat from which litter was estimated. The different sample sizes result from two previously unfertilized plots being accidentally fertilized in 2019 after which these plots were considered fertilized plots. These results are from ‘eDiValo’ field experiment; see Fig. 1 and Methods.

